Please note the use of the word “Example” in this article’s title. Note also the lack of the word “Recommendation” and note especially the lack of words such as “You”, “Can’t” and “Lose”.
In my last article I noted that much of the commodity world seems to be at a fairly critical juncture. After years of declines many commodities have been moving sideways to slightly higher and a number have touched multi-year support levels. One such commodity is silver. Now the truth is that I personally cannot make much of a bullish or bearish argument regarding where silver might be headed next. But I do see some indications that it may be “moving” in a meaningful way soon. So let’s look at why I say that and one example play on ticker SLV, the ETF that tracks the price of silver.
See also: A “Creative Play” in Natural Gas
Conflicting Elliott Waves
In Figure 1 we see that the weekly Elliott Wave count (as calculated by ProfitSource by HUBB) is pointing to the potential for lower prices in the months ahead. Figure 1 – SLV with Weekly Elliott Wave count (Courtesy: ProfitSource by HUBB)
On the other hand, in Figure 2 we see that the daily Elliott Wave count is pointing to the potential for higher prices in the weeks ahead. Figure 2 – SLV with Daily Elliott Wave count (Courtesy: ProfitSource by HUBB)
So which count is right – daily or weekly? Unfortunately I have to go with my standard answer of “it beats the heck out of me.” Still – adn interestingly – this does not preclude a trader from entering a position that can make money regardless of which Elliott Wave count proves to be correct (but which, alas, can lose money if neither wave count proves to be correct and silver remains in a trading range).
Example Trade
So to take it from “Soup to Nuts” so to speak, let’s assume that a trader:
*Has a $20,000 trading account
*Is willing to commit 5% to a single trade
*Would prefer not to risk the entire 5%
*Isn’t sure which way silver might move but is reasonably confident that SLV will break out of its recent trading range sometime in the not too distant future.
This sounds like a potential scenario for entering a long straddle using options, using no more than $1,000 ($20,000 x 5%). Figure 3 displays the particulars for buying:
*8 August SLV 15.5 Calls @ $0.61
*8 August SLV 15.5 Puts @ $0.63
 Figure 3 – Long SLV August 15.5 straddle (Courtesy www.OptionsAnalysis.com)
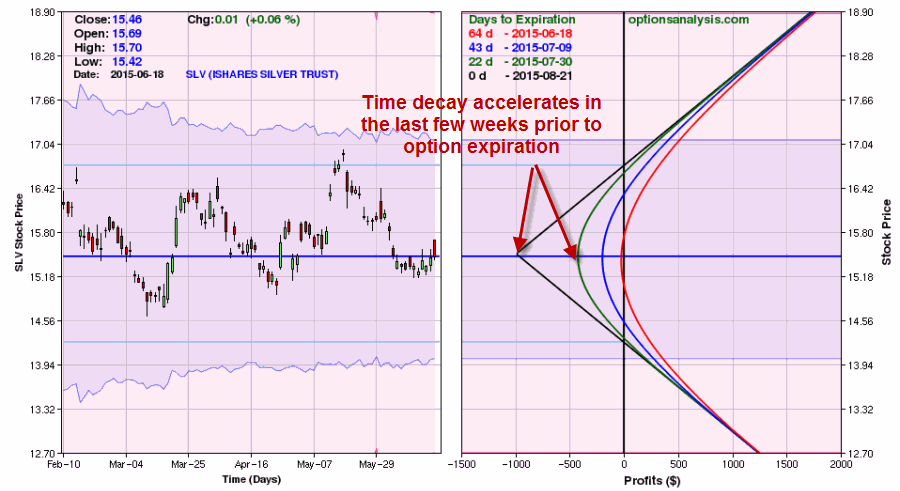
Figure 4 displays the risk curves for this trade, with each line representing the expected profit or loss based on the price for SLV as of a given date. The distance between the black line and the green line at a price of $15.50 highlights the negative effect of option price time decay as option expiration draws near (i.e, if SLV is unchanged in price as expiration draws near both the call and the put will lose time premium at an accelerating rate which would increase the loss on the trade).
We can use this knowledge to help us plan how to manage this trade. Figure 4 – Risk curve for SLV straddle held to expiration (Courtesy www.OptionsAnalysis.com)
What we see in Figure 4 is the following:
*If this trade is held until expiration on 8/21 and SLV closes that day at $15.50 both options will expire worthless and the trade will lose $992.
*If SLV is between $14.26 and $16.74 on 8/21 this trade will show a loss.
*If SLV is above $16.74 or below $14.26 on 8/21 this trade will show a profit.
However, we do not have to hold this position until expiration if the opportunity arises to take an early profit.
Planning Trade Management
To zero in on “where this trade lives” let’s do the following:
*We will set the upper and lower price targets to the upper and lower Elliott Wave price targets that appear in Figures 2 and 1 respectively – in other words, an upper target of $17.31 and a lower target of $13.26.
*We will plan on exiting the trade no later than 8/7, which is 14 days prior to August expiration. This will limit the potential damage due to time decay.
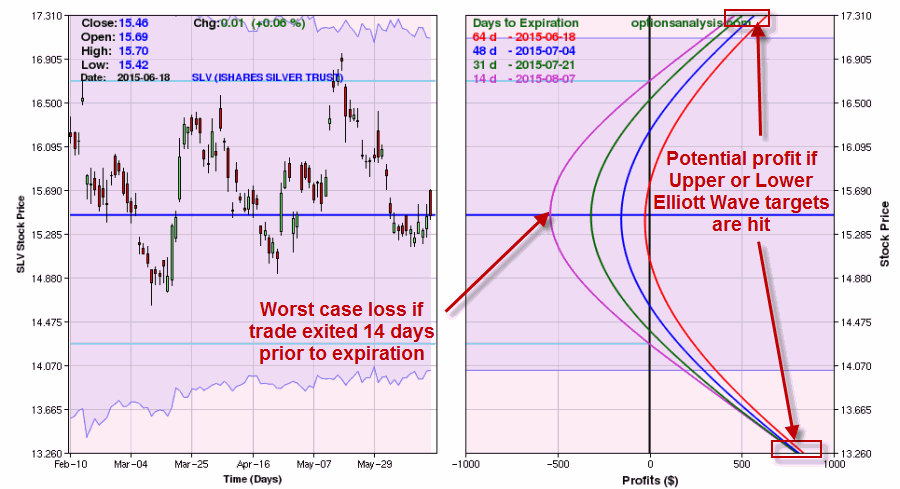
This plan gives us the scenarios that appear in Figures 5 and 6. Figure 5 – SLV Straddle held through 2 weeks prior to expiration (Courtesy www.OptionsAnalysis.com)
 Figure 6 – Risk curves for SLV straddle through 2 weeks prior to expiration(Courtesy www.OptionsAnalysis.com)
*In Figure 5 we see that although we still have to put up the full $992 to enter the trade, if we exit by 8/7 the likely “worst case” scenario is a loss of roughly -$538. The bottom line is that if SLV remains inits recent trading range then this trade will lose money.
In Figure 6 we see that:
*If price hits the upper target of $17.31 then the profit will range from roughly $490 to $600, depending on how soon that price is hit.
*If price hits the lower target of $13.26 then the profit will be in the $750 range.
Summary
I cannot state that this will turn out to be a good trade. It sure is a pretty example though of one way to play a market that:
*Has been consolidating and/or bouncing off of support
*Has some expectation of making a move in some direction (based on daily and weekly Elliott Wave counts in this example)
*Offers a decent tradeoff between reward and risk if traded using options.
There may be more opportunities shaping up within the “exciting world of commodities.” With many commodities markets at critical junctures now seems like a good time to start exploring other similar opportunities.
Jay Kaeppel


One thought on “An Example Commodity Play in SLV”
Comments are closed.