Please see also Jay Kaeppel named Portfolio Manager for New Investment Program
I last wrote about the fact that over the past 50 years, the Dow Jones Industrials Average has gained almost exactly zero net points during the months of June, July and August. I also highlighted the fact that in light of this performance, investors and traders might need to get a little “creative” if they actually wish to make money during these months. So this time out, let’s “get a little creative” and highlight one possible way to potentially take advantage of “summer boredom.”
(For other “Summer Strategies” see Jay’s recent posts: Will Natural Gas Break Wind in June? and Will Natural Gas Soar With the Wind in June?
This method involves a simple, commonly used option trading strategy. So of course, if you have no interest in options then you are free to stop reading here. Thanks for checking in and please come back soon. But before you sign off you might want to take one more glance at Figure 1 here and verify that you have no interest in considering alternatives to just “riding the market” for the next several months. (If you are an option trader please see the Special Offer to JayOnTheMarkets.com readers here).
Jay’s How to “Enjoy Summer Boredom” (ESB) Strategy
This method is based on the theory that big stock market moves in the summertime have shown a historical tendency to (WARNING: Impending “Highly Technical Trading Term”) “peter out”. However, this does not mean that every time a stock shoots higher for a few days that it marks a major top and signals an impending sharp decline. It is just not an uncommon event for a given stock to pop higher and then “meander” sideways to lower for a period of time. One way to potentially take advantage of this situation with stocks that you do not hold is to enter into a bear call credit spread. This involves selling an at-the-money or out-of-the-money call option on a stock or index and simultaneously buying a further out-of-the-money call option on the same stock or index. More money is taken in for the option sold than is paid out for the option bought.
Hopefully as the stock “meanders” sideways to lower, the options lose value and the position can eventually be bought back (or expire) for less than the amount received when the position was entered. The example that follows should answer any questions about the mechanics of the bear call credit spread.
Jay’s ESB Trading Rules:
-Today is during the months of June, July or August
-The 2-day RSI for a given stock or index is >=90
-The 14-day ADX value for that stock is below 25
-Ideally at least 1,000 options are traded per day for the stock in question and the bid/ask spreads are 2% or less
(A higher degree of confidence if ticker SPY or QQQ or RUT or VTI also show a 2-day RSI>=80 and/or if the 2-day RSI rises to 80 or above and then reverses for one day; but this is not a requirement)
-When this setup occurs selling an at-the-money or out of the money call option with 14 to 45 days left until expiration and buying another higher strike price call option.
Example
As you see in Figure 1, on 7/15/14 the 2-day RSI for SPY reversed lower after topping 80%. Figure 1 – SPY 2-day RSI reverses lower from above 80% (Courtesy: www.AIQSystems.com)
From here all of the analysis is done using www.OptionsAnalysis.com the software I use for all of my, well, option analysis, what else? (If you are an option trader please see the Special Offer to JayOnTheMarkets.com readers here).
We first go to Web Site | Lists | Filter List. The settings in Figure 2 are used to find stocks that have reasonable option volume and reasonably tight bid/ask spread on those options.
(Click on Figures below to enlarge them) Figure 2 – Looking for good option volume and tight bid/ask spreads (Courtesy www.OptionsAnalysis.com)
As you can see in Figure 3, this leaves us with 386 “high option volume, tight bid/ask spread” candidates. Figure 3 – Stock List Filter Output; 386 high option volume, low bid-ask spread candidates (Courtesy www.OptionsAnalysis.com)
We save these stocks to a “My Stock List” then go to Stocks | Rankers | RSI.
Figure 4 displays the input screen which allows us to look through the 386 tocks we just saved and find only those that have a 2-day RSI reading of 90% or higher. Figure 4 – Finding Stocks with 2-day RSI >= 90 (Courtesy www.OptionsAnalysis.com)
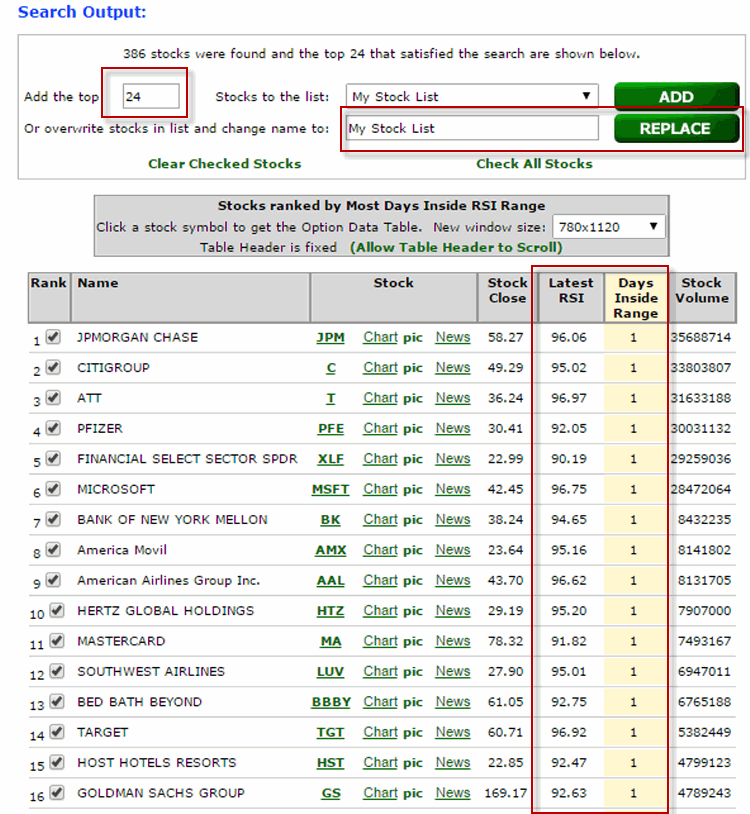
Figure 5 displays the output. We now have 24 stocks that meet our option volume and option bid-ask spread requirements and 2-day RSI readings >=90%. We save these by overwriting My Stock List with these 24 securities by clicking “Replace”. Figure 5 – Stocks with 2-day RSI >= 90 (Courtesy www.OptionsAnalysis.com)
*Next we go to Searchers | Multi-Strategies | Find Trades II.
In this routine I have created a “Wizard” for finding bear call credit spreads. This Wizard is selected by selecting “JK Test 1 Bear Call Credit” under “Saved Searches” and clicking “Replace” as shown in Figure 6. Figure 6 – Selecting Jay’s Bear Call Credit Spread Saved Search (Courtesy www.OptionsAnalysis.com)
This selects the bear call credit spread strategy and sets the default strategy inputs displayed in Figure 7.
 Figure 7 – Jay’s Bear Call Credit Input Criteria Settings (Courtesy www.OptionsAnalysis.com)
Among these inputs are:
*A Probability of Profit of 75% or more
*Stock Price >= $10
*Minimum sell price for an option is $0.50
*Minimum Option Volume is 1
*Minimum Option Open Interest is 100
*An option must have an active “Real Quote” in order to be considered
*Between 14 and 45 days left until expiration
*The call option sold must have a Delta of less than50.
Not shown is the fact that the selected “Sorting Criteria” is “Expected Profit/Risk.”
Figure 8 displays the trade output screen. In this case all of the top suggested trades were for ticker AAL. Figure 8 – Multi-Strategies Output screen (Courtesy www.OptionsAnalysis.com)
If we click on the top trade we get the particulars for that trade which appears in Figure 8. Note that I arbitrarily chose to display this trade as a 10-lot. This trade involves:
*Selling 10 AAL August 46 calls
*Buying 10 AAL August 50 calls
 Figure 9 – AAL August 46-50 Bear Call Credit particulars (Courtesy www.OptionsAnalysis.com)
Key things to note about this trade:
*Maximum profit potential = $800
*Maximum risk = $3,200
*Current stock price = $43.70
*Breakeven price = $46.80
*31 days left until option expiration
Figure 10 displays the risk curves for this trade. Each of the four colored lines displayed represents the expected $ profit or loss at a given stock price for four different dates. Below the breakeven price of $46.80 we see the lines drifting to the right (further into the profit zone). This illustrates the potentially positive effect of time decay working in our favor. Figure 10 – Risk curves for AAL August Bear Call Credit Spread (Courtesy www.OptionsAnalysis.com)
So Then What?
So let’s assume this trade was entered just as displayed in Figures 9 and 10. A trader has to decide (actually for the record these decisions should be made before entering the trade) when to take a profit and when to cut a loss. As with many things in trading there are no “Perfect Rules”. And in fact, there are too many possibilities to lit and discuss here. So let’s just choose some for examples sake and see what happened going forward.
Profit Taking Ideas:
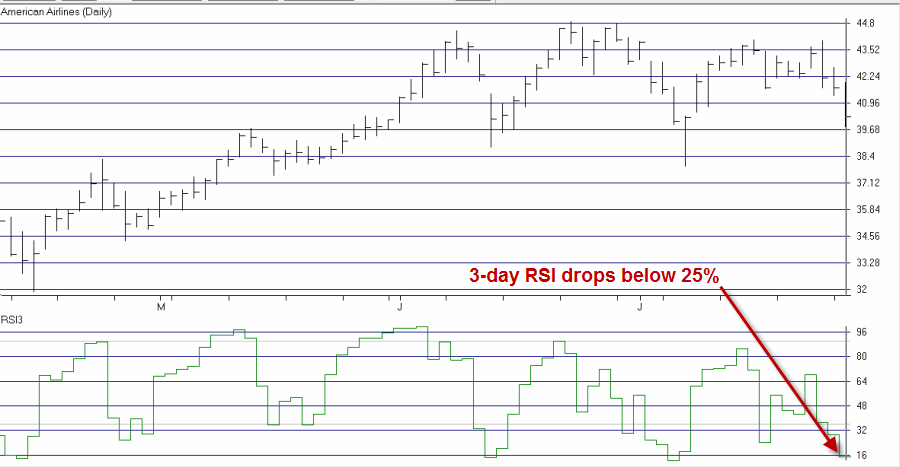
*If the 3-day RSI drops below 25% and we have a profit of any amount we may consider closing half of the open position.
*If we achieve an open profit of 20% or more prior to expiration (remember 25%, i.e., $800 / $3,200 – is our maximum profit potential) we may consider taking a profit and closing the entire position.
*As long as stock remains below price of option sold ($46) we can consider holding the position until option expiration.
Loss Cutting Ideas:
*If the stock breaks out above recent resistance at $44.88.
*If the position shows an open loss above $x (each trader needs to decide for themselves what value x should be)
*Cut a loss in the area where the various risk curve lines cross – in this case that is somewhere between $46.80 and $47.50. Again, each trader would need to decide for themselves.
So for example purposes, we will:
*Exit with a loss if AAL reaches or exceeds $46.80.
*Exit with a profit of 20% or more.
The Result
As you can see in Figure 11, by 7/28 AAL stock had fallen to $40.29 a shares, the 3-day RSI had dropped below 25%. Figure 11 – AAL stock declines triggering a profit-taking opportunity
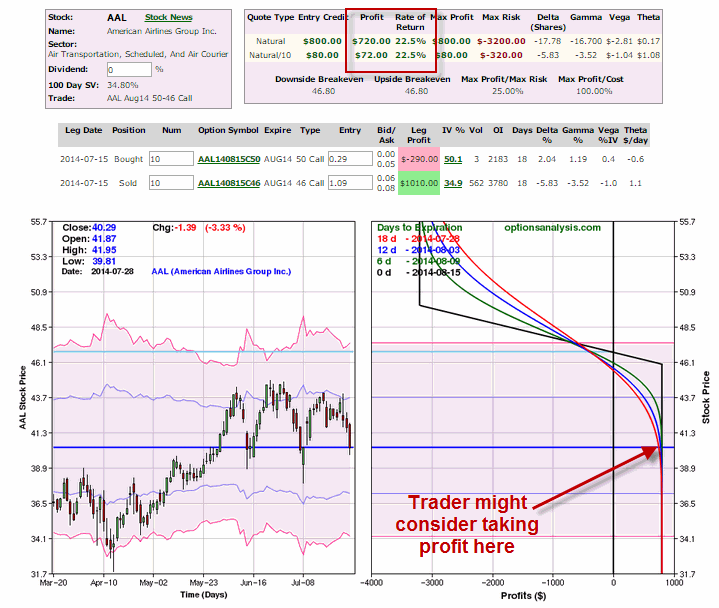
As you can see in Figure 12, at this point the trade was showing an open profit of $720 or 22.5%. At this point a trader could have closed the trade generating a profit of 22.5% in 13 calendar days. Figure 12 – AAL Bear Call Credit profit-taking opportunity (Courtesy www.OptionsAnalysis.com)
Summary
Now comes the important part. Repeat after me: “Not every trade will work out as well as this one.” Please repeat that phrase two or three, um, hundred times before proceeding.
The trade in this example serves only as an illustration. The key thing to note is the process which is intended to find trades that can put the odds in your favor and potentially take advantage of the “summer doldrums”.
Jay Kaeppel

