I have to admit I am a little surprised. It is the last day of April and so far I have only seen a couple hundred thousand “Sell in May and Go Away” related articles, as opposed to the usual several hundred bazillion such articles that usually make their appearance about his time each year. Still, what with May due to pop up at midnight tonight it seems like as good a time as any to chime in.
What You Probably Already Know
Historically the stock market has performed much better between the end of October and the third trading day of May that it has between the third trading day of May and the end of October. To wit, sees Figure 1 and 2.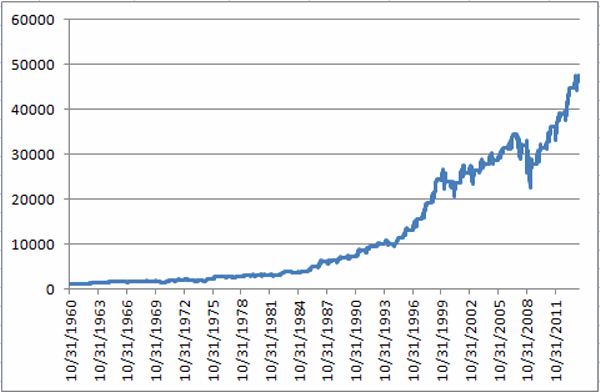 Figure 1 – $1,000 in the Dow from October 31st through 3rd trading day of May (1960-present)
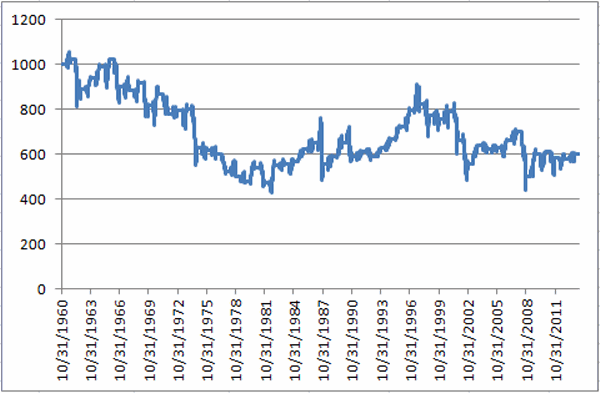 Figure 2 – $1,000 in the Dow from 3rd trading day of May to October 31st (1960-present)
Starting on 10/31/60:
* $1,000 invested in the Dow Industrials each year at the close of trading on the last trading day of October and held through the close of the third trading day of May grew to $47,280.
* $1,000 invested in the Dow Industrials each year at the close of trading on the third trading day of May and held through the close of the last trading day of October decreased to $599.
So to put it in blunt terms:
October to May = +4,628%
May to October = (-40%)
So clearly there is something to the “Sell in May” thing. There is a caveat, however. As you can see from a perusal of Figure 2 it is not as though the stock market declines each and every year during the May to October period. So during many years selling in May and getting back in at the end of October would cause your returns to trail that of the overall market (and we can’t have that now can we?).
So that explains why roughly half of the bazillion annual “Sell in May” related articles warn against blindly selling in May.
What You Probably Don’t Know
Like they always say, sometimes it’s not what you know but who you know that counts. Or in this case, not even someone I have personally met but do associate with. Rob Hanna is the head of Hannah Capital Management (www.QuantifiableEdges.com) and is a colleague of mine in AAPTA (American Association of Professional Technical Analysts). Rob revealed in some of his work the following “guide” for determining whether to “sell in May” or not:
-If the S&P 500 experiences a drawdown of 5% or more between December 31st and April 30th, then sell in May.
-If the S&P 500 DOES NOT experience a drawdown of 5% or more between December 31st and April 30th, then DO NOT sell in May.
Doesn’t get much simpler than that. Since 1960 there have been 14 years during which the S&P 500 did not experience a 5% drawdown and an investor would have simply remained in the market. The results appear in Figures 3 and 4. 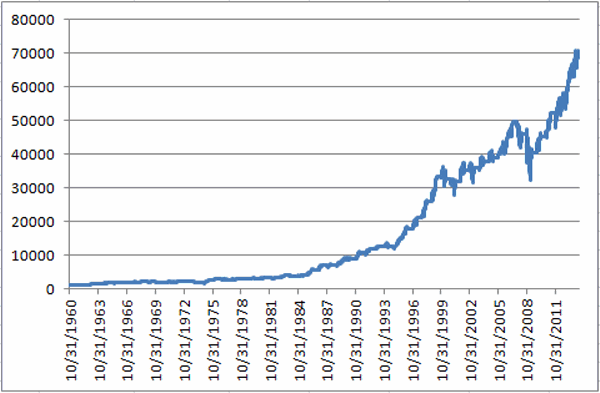 Figure 3 – $1,000 in the Dow during bullish periods applying Hanna Sell in May Filter (1960-present)
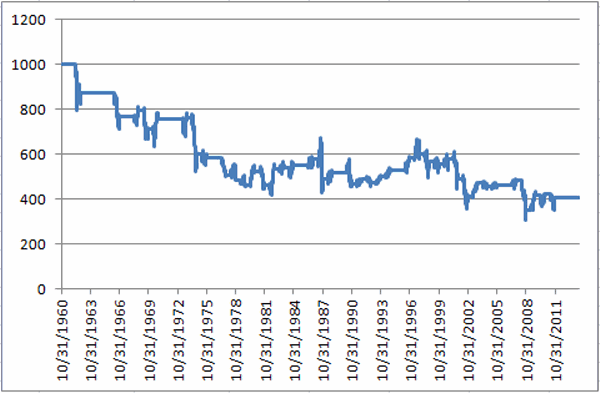 Figure 4 – $1,000 in the Dow during bearish periods applying Hanna Sell in May Filter (1960-present)
In cold hard numbers:
* $1,000 invested in the Dow Industrials each year durung the “bullish” periods described grew to $70,244.
* $1,000 invested in the Dow Industrials each year duirng the “beairsh” periods describeed decreased to $403.
So to put it in blunt terms, applying Rob Hanna’s Sell in May Filter:
*October to May (plus May to October when no Sell in May IS NOT triggered) = +6,924%
*May to October (only during years when Sell in May IS triggered) = (-59.7%)
Here’s The Bad News
As you can see in Figure 5, the S&P 500 experienced a drawdown of -5.76% between the end of December and the end of April. And -5.76% is greater than -5% (OK, mathematically speaking -5.76 is technically LESS than 5%, but you get my drift – there was a drawdown in excess of 5%).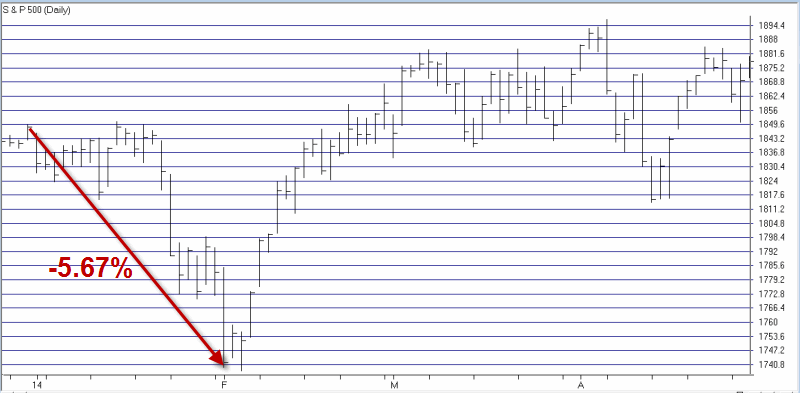 Figure 5 – S&P 500 for 2014
So by that rule, the Sell in May model that I prefer says to sell at the close on the third trading day of May and to buy back in at the end of October (although for the record, buying at the end of September is typically better in a mid-term election year, but that’s a topic for another article).
Summary
So because the S&P 500 experienced a -5.76% drawdown is the stock market absolutely, positively doomed to decline between May and the end of October? Of course not. But the historical odds seem to suggest that caution may be in order.
Jay Kaeppel


We also have constucted a study that improves on the classic “Sell in May” method. The key is to identify years that have been favorable, risk wise, towards allocating to equities ( as our model has ) and use them to “stay invested in May – Oct”.
http://seekingalpha.com/instablog/1109542-market-map/2878563-market-map-model-2-with-sell-in-may-goes-to-cash