In my book (WARNING: Shameless self plug to follow) “Seasonal Stock Market Trends”, I highlighted the fact that the very beginning, very end and very middle of the month tends to be bullish for stocks, and everything in between, well, not so much. The month of May as it turns out it a slight exception to the rule (OK, in the immortal words of Bill Murray, it’s actually more of a “guideline” than a “rule”, but I digress).
In any event, while the stock market has in fact showed a historical tendency to perform well during the beginning and end of the month of May, the entire time in between is pure “mush.”
The Beginning and End of May
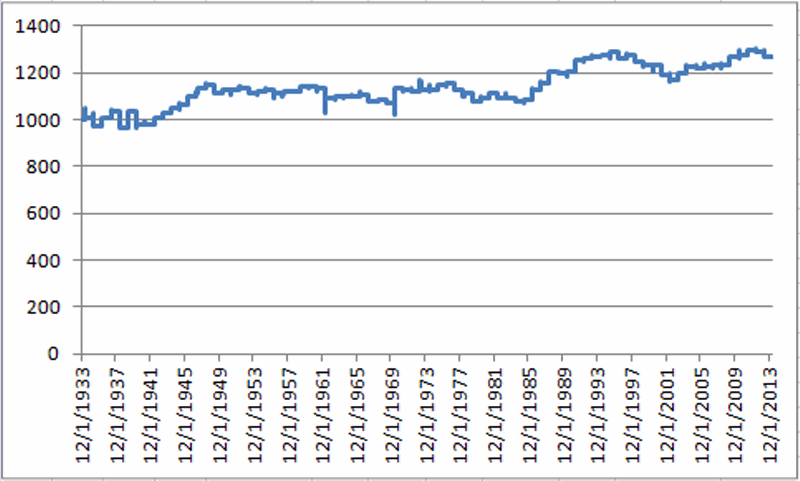
The first three days of May have followed the historically tendency for the first three days of most any month to perform reasonably well. The growth of $1,000 invested in The Dow Industrials only during the first three days of May every year starting 1934 appears in Figure 1. Figure 1 – Growth of $1,000 invested in Dow during 1st 3 days of May
All told, the first three days of May have showed a gain of +47.8% since 1934. Is this “good” or “bad”? Well, here is where a little perspective goes a long way. In any event, in the immortal words of whoever said it first, “I’ve seen woise.”
Now let’s look at the end of May. For this test we will look at trading days 17 and up. In other words, we will assume that one bought the Dow Industrials Average at the close on the 16th trading day of May every year since 1934 and held through the end of the month. The results for this test appear in Figure 2.  Figure 2 – Growth of $1,000 invested in Dow after trading day 16 during the month of May
This end of the month period for May has showed a +27.0% gain since 1934.
The Middle of May
Now let’s take a look at the historical performance during the middle of May – or as you may soon refer to them – The Bad Old Days.
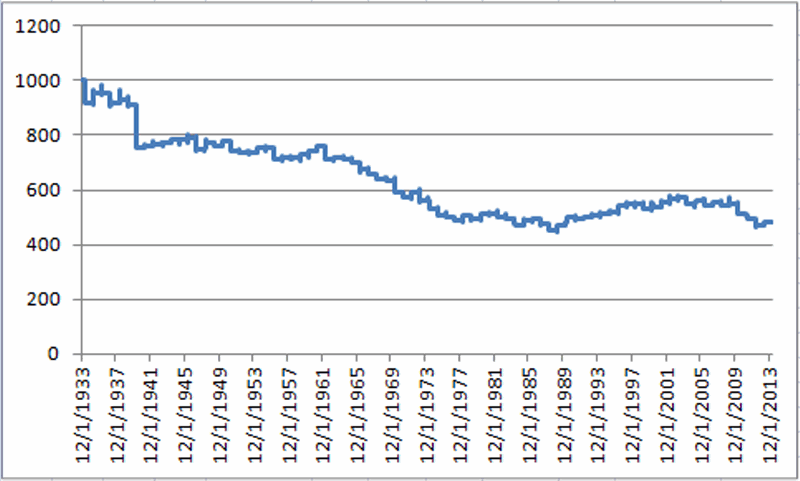
Figure 3 displays the growth (or perhaps I should say “destruction” of $1,000 invested in the Dow only between the end of trading day #3 and trading day #16 every May since 1934. Figure 3 – Growth of $1,000 invested in Dow during May trading days 4 through 16
As you can see the original $1,000 invested only during the middle of May declined -51.9% to $481.
Figure 4 displays the growth of $1,000 during the beginning and end of May (blue line) versus the middle of May (red line).  Figure 4 – The beginning and end of May versus the “Mush” in the middle
Notice any difference?
Summary
So is the beginning and end of May guaranteed to be “up” and is the middle of May guaranteed to be “down”? Not at all. Historically the beginning and end periods have seen the Dow gain a little over 70% of the time and the “middle” period – as I have defined it in this article has seen the Dow gain 47% of the time. So as always, there are no “sure things” in the stock market. Still, probabilities and historical tendencies can be useful.
In any event, do not be lulled into a false sense of security if the end of April, beginning of May time frame witnesses an advance in the stock market.
Remember, “beware the mush.”
Jay Kaeppel

