Or should it be, “Thar’s Gold in That There Garbage?” Well, in any event last time out I wrote about a strategy I learned from Gustavo Guzman, a former colleague of mine. Essentially a hedging strategy, the Garbage Trade is essentially a “bet a little, maybe make a lot” type of strategy. Basically, “when all is right with the world” is when you should be concerned about what it is you are not seeing. This strategy gives you the opportunity to “cover that base” without spending a lot of money to do so.
In case you have never noticed, markets can spend a long time advancing, steadily, quietly, grinding away to ever higher ground. And then often times, once everyone is comfortable with acknowledging that that particular asset is “clearly in an uptrend”, in the matter of a few short days or weeks the bottom drops out and a large part of the prior gain is wiped out in a fraction of the time it took to earn it. And let’s be honest, you almost never see it coming. That’s where the garbage trade comes in. For the details please see http://jayonthemarkets.com/2014/03/05/garbage-in-good-things-out/
This time out let’s look at another market that might be candidate for a little “garbage time.”
Gold – Where to From Here?
Gold appears to have put in a near-term bottom and gold stocks in particular have been quite strong of late. So the natural reaction is to sort of breathe a sigh of relief and start to consider how far the rally in the metal and the shares might last. But is that the right reaction? Maybe, maybe not.
In Figure 1 we see a daily Elliott Wave chart for ticker GLD – the ETF that tracks the price of gold – from ProfitSource by HUBB. As you can see the latest projection is, well, “one of the painful kind.” Now just because it appears on this chart doesn’t mean it will actually pan out. (While I look at Elliott Wave at times I am not a true ElliottHead. Although I have known people who would just as soon put you in a headlock, wrestle you to the ground and say “I’m not letting you up until you believe!” Fortunately, they get distracted easily by the next squiggly line that comes along). Still, it’s something.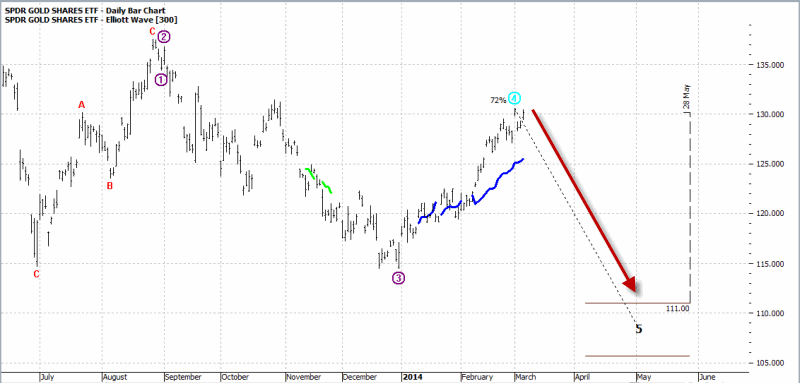 Figure 1 – Ticker GLD with Elliott Wave Projection (Courtesy: ProfitSource by HUBB)
In Figure 2 you see a chart also of GLD, this time from AIQ TradingExpert with the 3-day RSI drawn in the lower clip. What we have here is your classic “bearish divergence.” While price has kept moving to higher ground, the RSI has peaked at lower values on three separate occasions. Again, this does not mean that GLD is guaranteed to decline. But it too is, well, something. 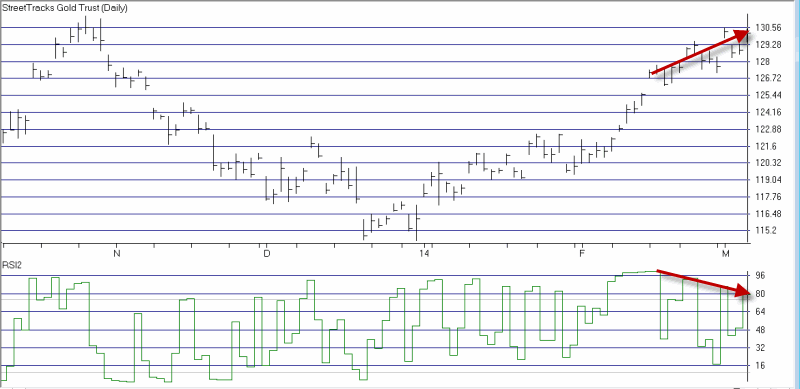 Figure 2 – Ticker GLD with Bearish RSI Divergence (Courtesy: AIQ TradingExpert)
Finally, the 128-138 range has been the “scene” of several support and resistance “battles” waged between GLD bulls and bears in the past. As you can see in the weekly chart of GLD in Figure 3, during previous skirmishes, GLD has had to do some work to cross through the 128-138 level and come out on the other side. 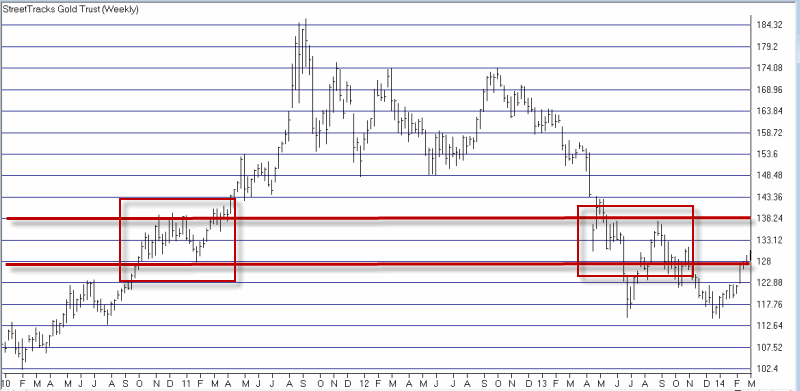 Figure 3 – GLD entering potentially significant resistance area of 128-138 (Coutresy: AIQTradingExpert)
So in any event, when you put all of this together, well, this my friends is a classic setup for a Garbage Trade, which again, involves risking a couple of bucks on an options trade for the potential of a high percentage return. Now please note that I did not start pounding the table and demand that you immediately sell short as many gold futures contracts as you possibly can afford. That would be what we traders often refer to as “stupid.”
The “Classic” Garbage Trade Example
Figures 4 and 5 show a classic 1x2x1 Garbage trade using June puts on GLD.  Figure 4 – GLD June 125-119-113 puts 1x2x1 ratio (Courtesy: www.OptionsAnalysis.com)
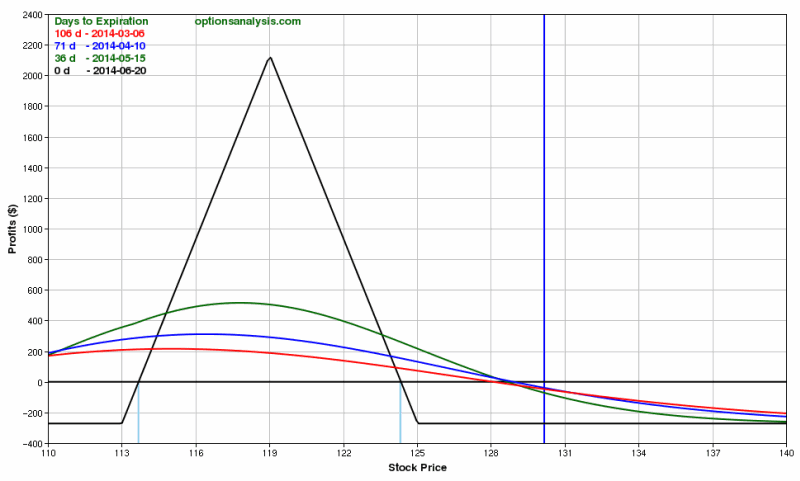 Figure 5 – GLD June 125-119-113 puts 1x2x1 ratio (Courtesy: www.OptionsAnalysis.com)
Note the maximum worst case risk is $272. If GLD does get down much past 119 the profit line starts to rollover, so somewhere in here would be a good place to take profits. Depending on how soon that target was reached the profit could be anywhere from $200to $550. A good return for a $270 investment.
The “Explosive” Garbage Trade Example
(“Explosive Garbage?” Note to myself: think about getting someone to write better titles for me.) Now let’s look at a way to sort of “go for the gold” (Wow, that was stupid even by my standards) and make a play that can make a lot more if gold really actually does break hard to the downside – while risking roughly the same amount. Figure 5 and 6 display a trade using the same option strikes (125-119-113) but this time trading them in a 2x3x2 ratio. In other words:
Buy 2 Jun GLD 125 puts
Sell 3 Jun GLD 119 puts
Buy 2 Jun GLD 113 puts
Figure 6 GLD June 125-119-113 puts 2x3x2 (Courtesy: www.OptionsAnalysis.com) 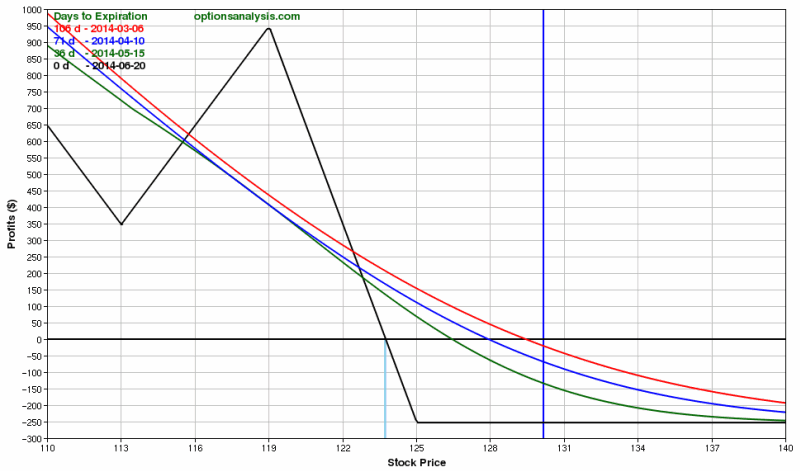 Figure 7 – GLD June 125-119-113 puts 2x3x2 (Courtesy: www.OptionsAnalysis.com)
What does this do for us? Well as you can clearly see in Figure 7 it opens up the potential for unlimited profit. So in this case, if the Elliott Gods smile and GLD goes in fact plummet down to 111 by the end of May, this trade could generate a profit of $900 to $1,000 roughly. This trade costs $253 to enter.
One comparative note: The 4x8x4 trade by far offers the greater profit potential if the trades are held until June option expiration and GLD happens to be between about 116 and 122. However, remember that we are not considering these two trades because “we think GLD will be between 116 and 122 on the third Friday of June 2014.” We are considering these two trades “just in case” GLD for some unforeseen reason breaks hard to the downside between now and the end of May (the Elloitt Wave timeframe).
Summary
So at this point there are a few questions to be asked and answered.
The obvious first question is: Will GLD decline sharply between now and the end of May? Sadly I have to go with my stock answer: “It beats the heck out of me.”
So the next question is: Is there a chance it will decline between now and the end of May? Given the bearish Elliott Wave projection, the bearish RSI divergence and the important resistance level in the 128-133 range, I am going to go ahead and say “Yes” there is a chance.”
If you answered “Yes” to that question, then the next question in “are you willing to bet on the chance it might happen?” You have to answer that one on your own.
And if you answered “Yes” to the previous question, then the final question is “Do you have $253 bucks?”
Jay Kaeppel


