OK, I should probably apologize right off the bat. For the record, I typically hate attention-grabbing titles like “The Only Indicator You Will Ever Need” and other stupid things like “What All Investors/Traders Should Do Right, er, well, you get the idea. Let’s just chalk it up as a tough week for writing headlines. Still, sometimes even an article with a self-serving, attention-bragging headline can hold at least a small kernel of knowledge that can make a difference for you over time.
At least, here’s hoping.
So how about a single stock market indicator that has over a 110-year track record and that has beaten the Dow Jones Industrials Average over that time by a factor of 1.4-to-1? Let’s take a closer look.
(Also for the record, and as long as I am apologizing for things, I should also point out that I do not actually advocate that you abandon all other forms of market analysis in favor of just the one I am about to describe. But it sure might make a useful addition to whatever you are using now).
The Coppock Guide
The Coppock Guide is a technical analysis indicator created by E.S.C. Coppock, first published in Barron’s Magazine on October 15, 1962 (As an aside, I don’t recall coming across a lot of people with three initials for their first name. Based on his work – as you will see in a moment – I am guessing its stands for “Exceptionally Superlong Calculations”. )
The indicator attempts to identify major buying opportunities in the stock market based on a shift in momentum. The indicator is only updated once a month using the monthly closing low for the Dow Jones Industrials Average.
In “Formula” form it is: Coppock=Weighted Moving Average[10 ] of (ROC[14]+ROC[11])
In “short form” it is: The sum of a 14-month rate of change and 11-month rate of change, smoothed by a 10-period weighted moving average.
In “Exceptionally Superlong Calculations” form it is:
A=Calculate the percentage gained or lost by the Dow over the past 11 months.
B=Calculate the percentage gained or lost by the Dow over the past 14 months.
C=Calculate the average of these two readings
D=Calculate a 10-month front-weighted moving average of C*
* Multiply this month’s average *10, last month’s * 9, the month before that by 8, etc. Then add together all of the values and divide by 55.
The resulting value for D is this month’s Coppock Guide value.
(Given these calculations is anyone surprised to learn that Coppock was an economist? (although given the usefulness of his indicator we won’t hold that against him).
The Guide Itself
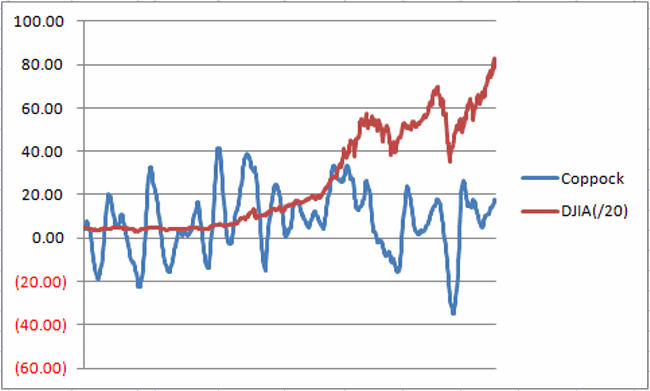
Figure 1 displays the Coppock Guide with the Dow Jones Industrials Average since 1969. Figure 1 – Coppock Guide (blue line) and Dow Jones Industrials Average (divided by 20) since January 1969
The standard interpretation is to wait for the Coppock Guide to drop into negative territory and then turn up as a sign of a buy signal. And there is some value to that interpretation. But I have found that there is another way.
Jay’s Coppock Trend System
To put is as succinctly as possible:
*Up is good
*Down is bad
(OK, clearly I am never gonna make it as an economist)
But how do we define up and down? Here goes:
*The trend is UP if the Coppock Guide closes this month above its level of 3 months ago.
*The trend is DOWN if the Coppock Guide closes this month below its level of 3 months ago.
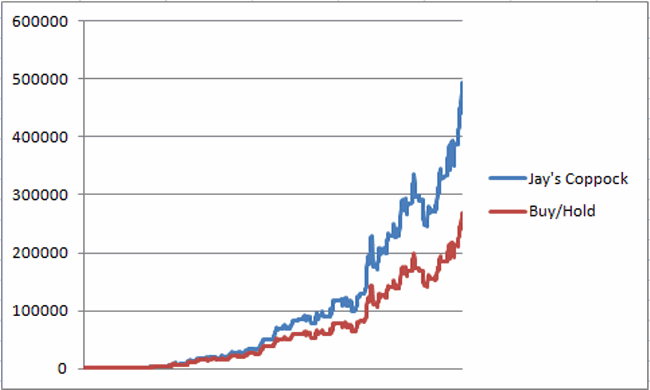
How good is up? And how bad is down? Figure 2 displays the growth of $1,000 starting in 1902 through today using this method (and assuming that 1% of interest is earned annually while out of the stock market) versus a buy-and-hold approach.  Figure 2 – Jay’s Coppock Trend System versus Buy and Hold (December 1902 through January 2014)
My version most recently turned bullish at the end of October 2012 and (for better or worse) remains so as of the end of January 2014.
So how does this simple method compare to buying and holding the Dow?
For the record, as of 1/31/2014:
*$1,000 invested at the starting point of this test at the end of 1902 using a buy-and-hold approach would be worth $333,309.
*$1,000 invested using my Coppock Trend System would be worth $466,911.
*My Coppock Trend System was only in the stock market about for 606 out of 1,333 months, or 45.6% of the time and in cash 54.4% of the time.
One other thing to note:
*When my Coppock Trend System was bullish, the Dow gained +25,382%.
*When my Coppock Trend System was bearish, the Dow gained only +31%.
You don’t need to be an economist to recognize that the difference between those last two numbers is “statistically significant”.
Summary
So is the original Coppock Guide or my simple adaptation really the only indicator you will ever need? In all candor the answer is certainly “no.” So I apologize again if you got sucked in by the headline. But perhaps not all that profusely. For given the indicator’s apparent usefulness over such a long period of time, you might be wise to take note at the end of each month whether it is presently bullish or bearish.
Jay Kaeppel
Follow me on Twitter @jaykaeppel


did you compare to golden cross or 200sma ?
Please see my followup post. Jay
I tried to replicate the Coppock Guide, but it resulted in less than buy and hold. I copied the McClellan data. Any thoughts
Please see my followup post. Jay
Glenn you are right, I replicated the Coppock Guide and the results werent as good as buy and hold. I got the data from Bloomberg. It´s true that you stay in the market just half of the time but the same can be said using a simple moving average
Please see my followup post. Jay