OK I’ll admit I am a little early with this one. But maybe not as early as you might think. In fact, as I was out driving I saw the first house in my neighborhood to have Christmas lights up…and lit. Hey, desperate times I guess.
While the stock market continues to push to new highs, “morale” is not quite what one might expect. This may be due in part to the fact that it is near impossible to peruse the financial media these days and not come away with a sense of foreboding, given all of the warnings and admonitions and liberal use of word like “frothy” and “bubble.” And make no mistake, I have voiced a few concerns recently myself and have gone so far as to suggest that investors consider hedging with VXX call options (http://jayonthemarkets.com/2013/10/30/is-vxx-issuing-a-warning/) from time to time.
Still, as a person who has been involved in the financial markets for a while I understand the power of the trend. So despite all of my personal concerns about the economy, debt, etc., etc., 2013 has been good to “go with the flow” kind of people. In the short-term, the stock market does appear to be a bit “overbought” and perhaps “due for a correction.” But while anything can happen, history suggests that people who are looking for a stock market collapse before the end of the year may be disappointed. Cue the Christmas music.
The Santa Claus Rally
As I define it, the Santa Claus rally time period:
-Begins at the close of trading on the Friday before Thanksgiving.
-Extends through the close of the third trading day of January.
And that’s all there is to it.
So how has the stock market performed during this period in the past? I am so glad you asked.
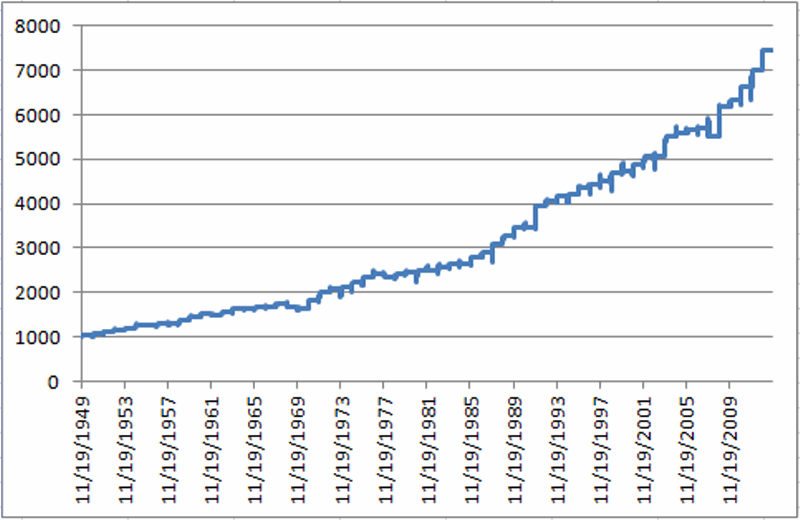
Figure 1 displays the growth of $1,000 invested in the Dow Jones Industrials Average only during the pre-Thanksgiving through post-New Year’s period I just described, starting in November 1949.  Figure 1 – Growth of $1,000 invested in Dow Jones Industrials during Santa Claus Rally period (1949-2012)
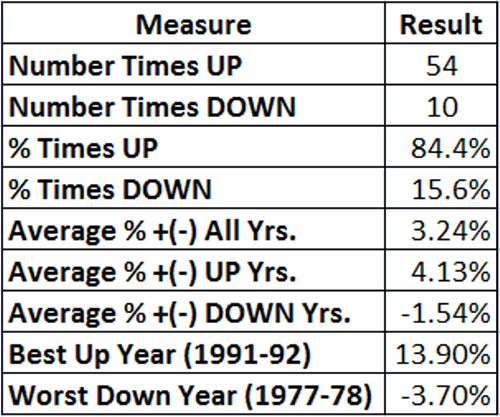
Figure 2 displays some important figures regarding this performance.
Figure 2 – Stock Market Performance during Santa Claus Rally Time Period
One other thing to note is that this Santa Claus Rally time period has witnessed an advance by the Dow during 26 of the last 28 and 32 of the last 35 years. It’s tough to the beat that kind of consistency.
Summary
So does all of this mean that “you can’t lose” trading stocks during this “sure thing” time period guaranteed to generate “above average, risk free” returns? Ah, if only. All any of this really means is that stocks have performed well during this time period in the past. What will happen this year remains to be seen.
Still, the real point is that investors may be wise to give the bullish case every benefit of the doubt starting in late November.
Jay Kaeppel
P.S. For all of you “numbers geeks” out there, the annual performance during the Santa Claus Rally Time period appears below
| Period Ending | DJIA % +(-) |
|
1/5/50 |
3.6 |
|
1/4/51 |
4.0 |
|
1/4/52 |
3.9 |
|
1/6/53 |
4.6 |
|
1/6/54 |
2.9 |
|
1/5/55 |
5.1 |
|
1/5/56 |
0.2 |
|
1/4/57 |
3.7 |
|
1/6/58 |
(0.0) |
|
1/6/59 |
5.7 |
|
1/6/60 |
5.8 |
|
1/5/61 |
3.2 |
|
1/4/62 |
(1.0) |
|
1/4/63 |
5.0 |
|
1/6/64 |
5.0 |
|
1/6/65 |
(1.2) |
|
1/5/66 |
3.0 |
|
1/5/67 |
(0.5) |
|
1/4/68 |
4.3 |
|
1/6/69 |
(3.1) |
|
1/6/70 |
(2.4) |
|
1/6/71 |
10.0 |
|
1/5/72 |
11.6 |
|
1/4/73 |
3.4 |
|
1/4/74 |
2.0 |
|
1/6/75 |
3.6 |
|
1/6/76 |
6.0 |
|
1/5/77 |
3.1 |
|
1/5/78 |
(3.7) |
|
1/4/79 |
3.6 |
|
1/4/80 |
1.6 |
|
1/6/81 |
1.5 |
|
1/6/82 |
0.9 |
|
1/5/83 |
2.3 |
|
1/5/84 |
2.5 |
|
1/4/85 |
(0.3) |
|
1/6/86 |
5.7 |
|
1/6/87 |
4.3 |
|
1/6/88 |
6.5 |
|
1/5/89 |
6.2 |
|
1/4/90 |
5.4 |
|
1/4/91 |
0.6 |
|
1/6/92 |
13.9 |
|
1/6/93 |
2.4 |
|
1/5/94 |
2.8 |
|
1/5/95 |
0.9 |
|
1/4/96 |
3.7 |
|
1/6/97 |
1.5 |
|
1/6/98 |
1.8 |
|
1/6/99 |
4.2 |
|
1/5/00 |
1.1 |
|
1/4/01 |
2.7 |
|
1/4/02 |
4.0 |
|
1/6/03 |
(0.4) |
|
1/6/04 |
9.5 |
|
1/5/05 |
1.3 |
|
1/5/06 |
1.1 |
|
1/5/07 |
0.4 |
|
1/4/08 |
(2.9) |
|
1/6/09 |
12.0 |
|
1/6/10 |
2.5 |
|
1/5/11 |
4.6 |
|
1/5/12 |
5.3 |
|
1/4/13 |
6.7 |

