As I wrote about last week (http://jayonthemarkets.com/2013/08/19/september-looms-and-why-you-should-care/), the month of September has a well earned reputation as the worst month historically for the stock market. However, Wayne Whaley of Witter & Lester, Inc. in Huntsville, AL and a colleague of mine in the American Association of Professional Technical Analysts (AAPTA for short, mercifully) recently posted a fascinating insight regarding the month of September. Now I don’t want to try to steal his thunder so I am going to leave out most of the numbers. But here is the gist: Since 1950, if the S&P 500 index is up in July and down in August, then the S&P 500 has showed a gain in September 11 out of 15 times, including the last 8 in a row. The last occurrence was 2010, when the S&P gained 8.76% during September.
Unless the market rallies very sharply in the last few days of August this year, the pattern will be in place once again, suggesting a bullish September rather than the “traditional” bearish one. That being said, there is still the “early September” versus “late September” effect.
Bullish Setup Septembers
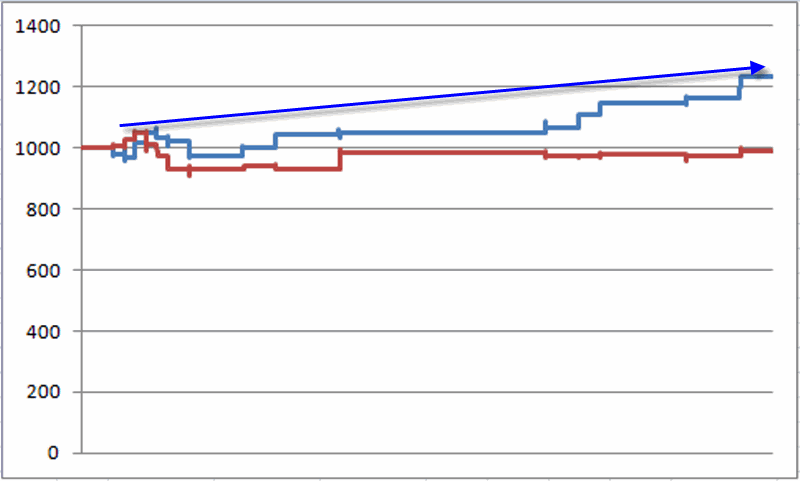
Figure 1 displays the growth of $1,000 invested in the Dow Jones Industrials Average during those Septembers since 1950 that were preceded by an up July and a down August as follows:
-The blue line represents the growth of $1,000 invested in the Dow during the first 11 trading days of September during these “bullish setup” years.
-The red line represents the growth of $1,000 invested in the Dow during September trading days after the 11th trading day of the month during these “bullish setup” years.
Figure 1 – If July is up and August is down, growth of $1,000 invested in Dow during first 11 trading days of September (blue line) versus trading days 12 through 21 (red line)
As you can see, typically the bulk of the strength occurs in the first 11 trading days of September, with the days after that being kind of “hit or miss.” So if August 2013 closes with a loss for the S&P 500, it might make sense to look for favorable stock market action through September 17th (trading day #11). After that, all bets are off.
Non Bullish Setup Septembers
One other interesting (OK, interesting in a “Hi, my name is Jay and I am a numbers geek” kind of way) thing to note is that Wayne’s finding helps uncover one of the most persistently bearish seasonal trends around.
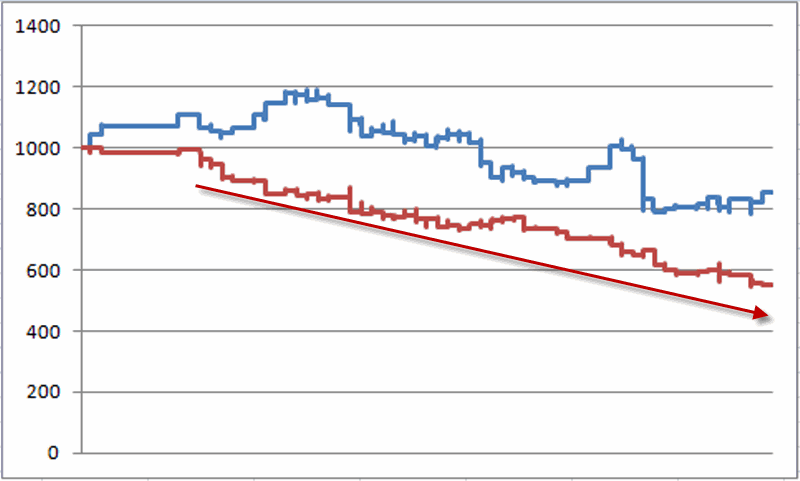
Figure 2 displays the growth of $1,000 invested in the Dow Jones Industrials Average during those Septembers since 1950 that were preceded by anything other than up July and a down August as follows:
-The blue line represents the growth of $1,000 invested in the Dow during the first 11 trading days of September during these “non bullish setup” years.
-The red line represents the growth of $1,000 invested in the Dow during September trading days after the 11th trading day of the month during these “non bullish setup” years.
Figure 2 – If something other than “July is up and August is down”, growth of $1,000 invested in Dow during first 11 trading days of September (blue line) versus trading days 12 through 21 (red line)
As you can, if Wayne’s up July, down August pattern is not in force, the first 11 trading days of September are nothing to write home about, but more significantly, the performance of the Dow during September trading days 12 through 21 represent something resembling an escalator to hell.
Summary
If any of this holds true to form this year, then:
-If the S&P 500 closes down for the month of August, the market may surprise to the upside at least through September 17th.
-(Ironically) if the S&P 500 musters a significant rally in the next several days and closes August with a gain, some sort of defensive action – whether selling something to raise cash or hedging with options – would appear to be in order, particularly during the second half of September.
As I said last time, just in case, please keep those seatbelts fastened.
Jay Kaeppel


