It is hard to look at Figure 1 and argue that the trend of the stock market is anything but bullish. Major averages making new all-time highs is essentially the very definition of a bull market. And indeed the market may continue to push higher indefinitely. Figure 1 – Four Major Averages all at or near all-time highs (Courtesy AIQ TradingExpert)
Trying to “pick a top” usually ends with an embarrassed prognosticator. Particularly when the major market averages are posting new highs. Still, there comes a time when it can pay to pay close attention for signs of “Trouble in Paradise”. That time may be now.
Four Bellwethers
In this article I wrote about 4 “bellwethers” that I follow for potential “early warning signals”. So far no “run for cover” signals have appeared. Two of the four have confirmed the new highs in the market averages and the other two have not. If and when 3 or 4 of them fail to confirm that may signal trouble ahead. Figure 2 – XIV and BID confirm news highs; SMH and TRAN so far have not (Courtesy AIQ TradingExpert)
XIV and BID have confirmed new highs in the major averages (although the parabolic nature of XIV’s run is somewhat troubling to me) while SMH and the Dow Transports have not.
Post-Election/Year “7” Bermuda Triangle
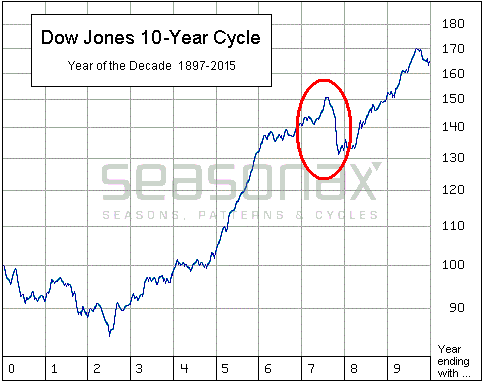
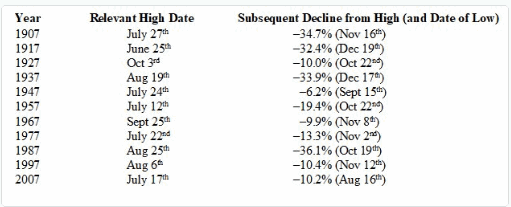
I have written about this a few times but it bears repeating here. Post-Election Years and Years ending in “7” (1907, 1917, etc.) have typically witnessed “trouble” in the second half of the year. Figures 3 and 4 are posted courtesy of a Twitter post from Larry McMillan of the Option Strategist.
Figure 3 highlights the fact that the 2nd half of “Years 7” have often witnessed “trouble.”
Figure 4 show that each “7” year posted a high during the 2nd half of the year (or in June) and then suffered a decline. This does not guarantee a repeat this year but it is a warning sign.
Figure 3 – Decade Pattern for the Dow Jones Industrials Average (Courtesy: Options Strategist)
Figure 4 – Years “7” (Courtesy: Options Strategist)
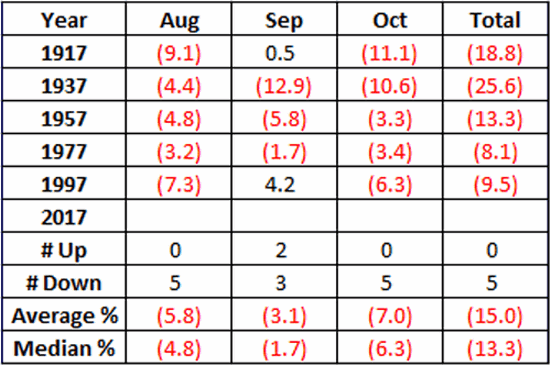
Also, during years that are both “post-election” years AND “Years ending in 7”, the August through October results have been brutal- as depicted in Figure 5 – with an average 3-month decline of -15%.
Figure 5 – August/September/October of Post-Election Years that also End in “7”
Nothing in Figures 3 through 5 “guarantee” an imminent market decline. They do however, constitute the reason the word “Beware” appears in the headline.
Valuation
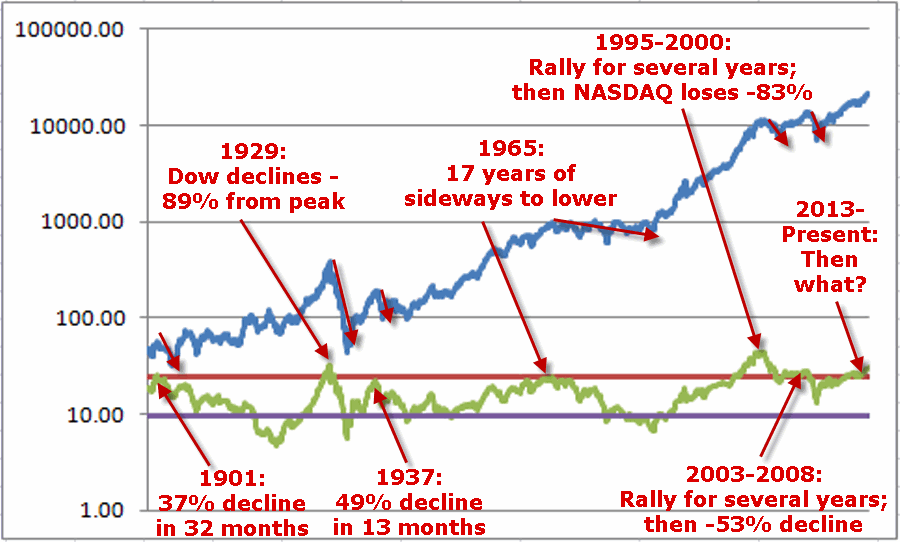
Last week I witnessed a presentation where a quite knowledgeable gentleman posted a chart of the Schiller PE Ratio. He made note of the fact that the Schiller PE Ratio has only been higher twice in modern history – 1929 and 2000. The 1929 peak was followed by an 89% decline by the Dow and the 2000 peak was followed by an 83% decline by the Nasdaq. So are we doomed to experience a devastating decline? Not necessarily. At least not necessarily anytime soon. The stock market became “overvalued” in 1995 and then continued to rally sharply higher for another 4+ years. Likewise, the market as theoretically been “overvalued” since 2013 – and so far so good.
Figure 6 shows the price action of the Dow Jones Industrials Average since 1901 in blue and the movements of the Schiller PE Ratio in green.
The peaks in the Schiller PE ratio in:
1901
1929
1937
1965
1995-2000
2003-2008
Were all followed by “something bad”.
While the exact timing is unknowable, as you can see in Figure 6, history does suggest that ultimately a “happy ending” is unlikely.
 Figure 6 – A History Lesson in High Shiller PE Ratio Readings: Dow Jones Industrials Average (blue line) and Schiller PE Ratio (green line); 1901-present
Summary
I absolutely, positively DO NOT possess the ability to “predict” what is going to happen in the financial markets. I have gotten pretty good however, at identifying when risk is unusually high or low.
Current Status: Risk High
Because I don’t offer investment advice on this blog – and because my track record of “market calls” is so bad, no one should interpret anything in this article as a call to “Sell Everything”, especially since I haven’t even done that myself – us “trend-followers” usually take awhile to give up the ghost. In reality, I hope that stocks continue to rally and that this article ends up making me looking stupid, er, I mean “overly cautious”.
But the real point is simply that having plans, mechanisms, etc. to reduce risk in your portfolio makes sense.
Jay Kaeppel
Disclaimer: The data presented herein were obtained from various third-party sources. While I believe the data to be reliable, no representation is made as to, and no responsibility, warranty or liability is accepted for the accuracy or completeness of such information. The information, opinions and ideas expressed herein are for informational and educational purposes only and do not constitute and should not be construed as investment advice, an advertisement or offering of investment advisory services, or an offer to sell or a solicitation to buy any security.


