Silver has been a hot, well, commodity of late. Although it did get pummeled the other day (just to get everyone’s attention). A lot of pundits are writing about “$50 silver!!” and a lot of investors and traders are struggling with the decision of whether or not to “take the plunge.” The potential rewards – and risks – are great. Figure 1 displays a monthly chart of ticker SLV, an ETF that tracks silver.
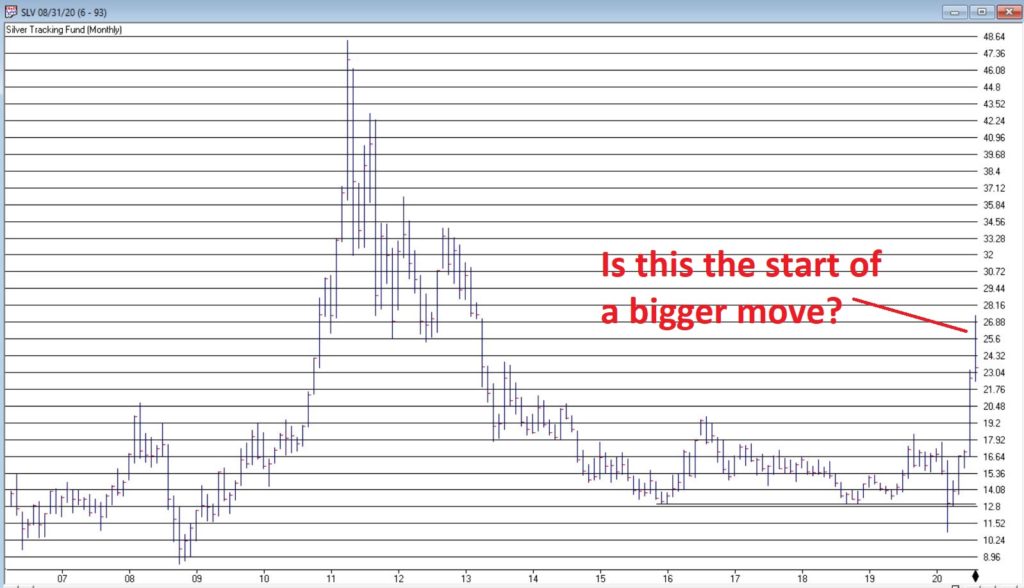
Figure 1 – Ticker SLV (Courtesy AIQ TradingExpert)
Buying 100 shares of SLV as I write would cost $2,342. If SLV were to ultimately advance to its previous high north of $48 a share an investor could double his or her money. But if the rally fizzles out and SLV tanks a loss of 50% is possible. What to do, what to do?
Another possibility is to buy a long-term call option. The problem here is captured in Figure 2. As you can see, implied volatility for SLV options is extremely high. What that implies (har), is that the amount of time premium built into SLV option is exceptionally high, and that a decline in IV levels could lead to a significant decline in the value of a call option as lower IV translates to lower time premium.
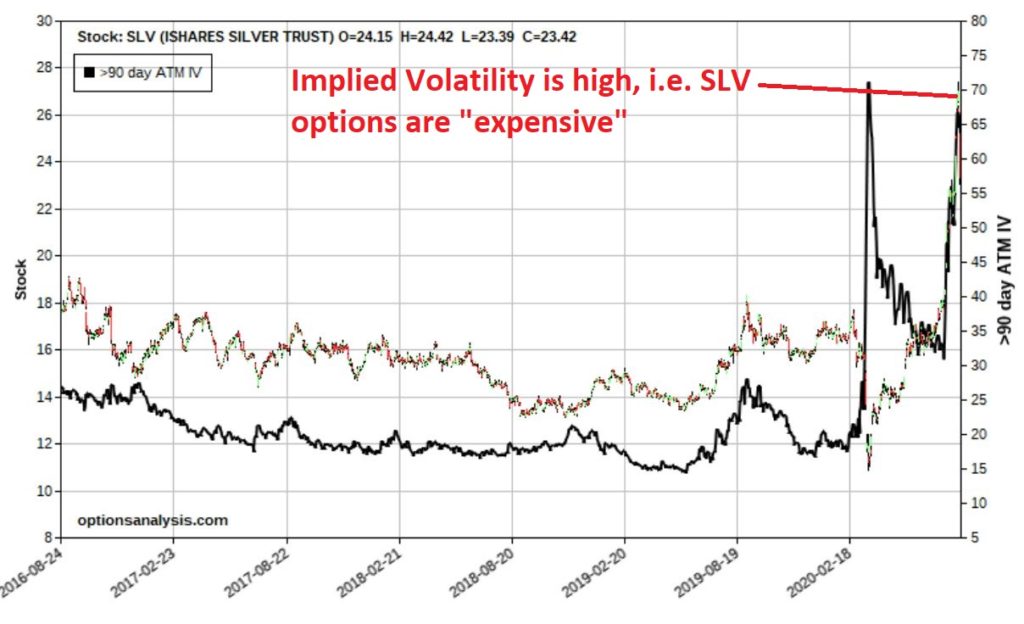
Figure 2 – Implied volatility for SLV option is very high, i.e., SLV options are “expensive”
Is there an alternative? Would I ask the question if the answer was “No?”
A Long-Term Out-of-the-Money Butterfly
I’m going to keep this short. As always, the trade that follows is an “example” of one way to play given an extremely volatility underlying security and extremely high implied volatility, and NOT a “recommendation.” It also is sized to serve as a replacement for simply buying 100 shares of SLV (cost and total risk = $2,342)
The trade goes as follows:
*Buy 8 SLV Jan 2022 24 calls @ $5.65
*Sell 12 SLV Jan 2022 39 calls @ $2.68
*Buy 4 SLV Jan 2022 54 calls @ $1.73
The details appear in Figure 3 and the risk curves in Figure 4.
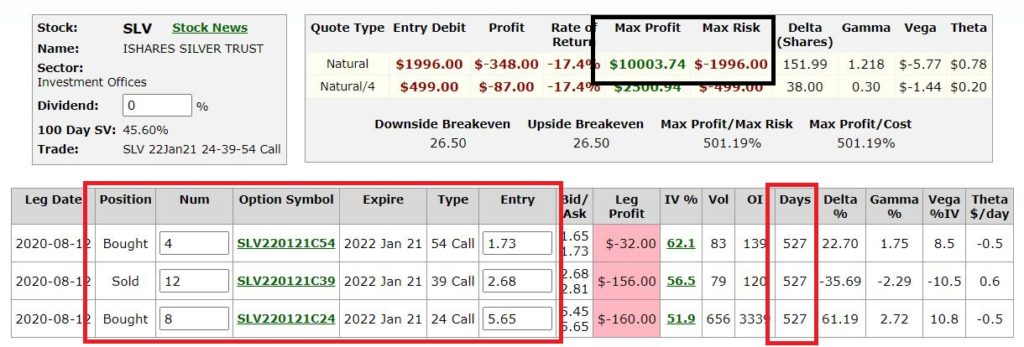
Figure 3 – SLV OTM butterfly details (Courtesy www.OptionsAnalysis.com)
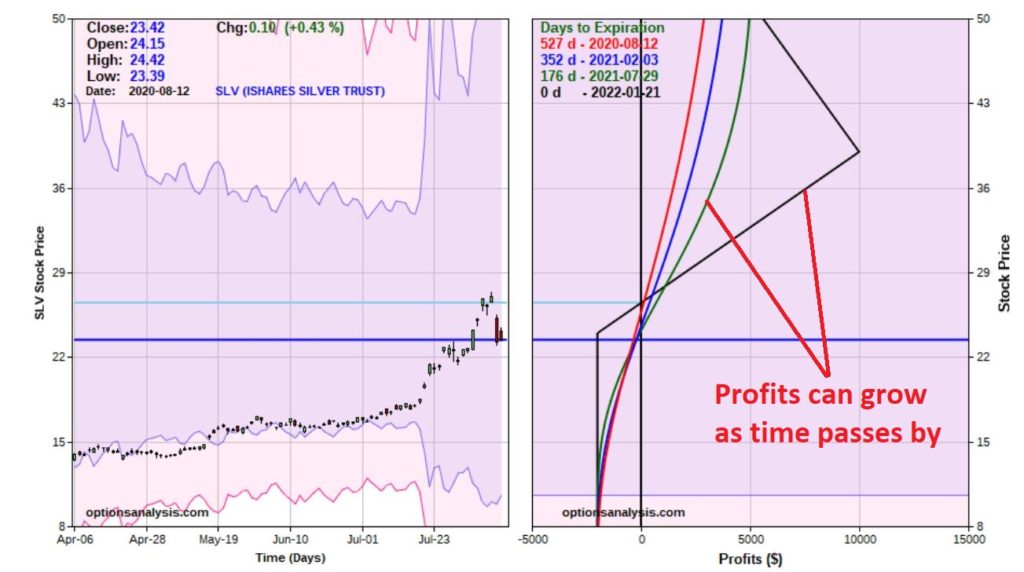
Figure 4 – SLV OTM butterfly risk curves (Courtesy www.OptionsAnalysis.com)
Things to note:
*This trade costs $1,996 to enter
*Clearly, a rise in SLV price will generate a profit and a decline will generate a loss
*The primary advantage to this trade is, a) SLV has almost a year and half to make a meaningful up move, and b) if SLV does rise in price, time decay begins to work in the trades favor (note that the risk curve lines move to higher ground as time goes by as long as SLV is above the breakeven price
Finally, let’s compare this position to buying and holding 100 shares of SLV. Figure 5 adds the risk curve (actually a straight line) for holding 100 shares of SLV to Figure 4.
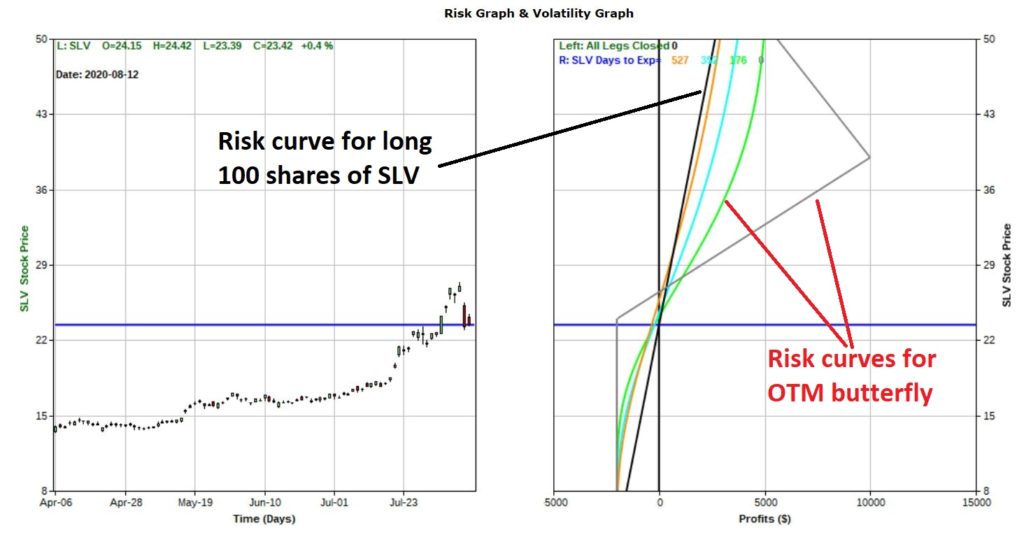
Figure 5 – SLV OTM Butterfly versus long 100 shares of SLV (Courtesy www.OptionsAnalysis.com)
Note that:
*The black line in Figure 5 represent the profit potential for the long 100 shares of SLV position
*The colored lines in Figure 5 represent the expected profit/loss for the OTM butterfly as of various dates leading up to breakeven
*Above the breakeven price the OTM butterfly enjoys a great deal more profit potential
*Below the breakeven price the OTM butterfly has more downside dollar risk (until SLV reaches about $5 a share (not shown)
Summary
Once again, this is an example and not a recommendation. But the relevant question is “does the OTM butterfly trade make sense?” Possibly – for a trader who wants to play potential for a further up move in SLV.
See also Jay Kaeppel Interview in July 2020 issue of Technical Analysis of Stocks and Commodities magazine
See also Jay’s “A Strategy You Probably Haven’t Considered” Video
See also Video – The Long-Term…Now More Important Than Ever
Jay Kaeppel
Disclaimer: The information, opinions and ideas expressed herein are for informational and educational purposes only and are based on research conducted and presented solely by the author. The information presented represents the views of the author only and does not constitute a complete description of any investment service. In addition, nothing presented herein should be construed as investment advice, as an advertisement or offering of investment advisory services, or as an offer to sell or a solicitation to buy any security. The data presented herein were obtained from various third-party sources. While the data is believed to be reliable, no representation is made as to, and no responsibility, warranty or liability is accepted for the accuracy or completeness of such information. International investments are subject to additional risks such as currency fluctuations, political instability and the potential for illiquid markets. Past performance is no guarantee of future results. There is risk of loss in all trading. Back tested performance does not represent actual performance and should not be interpreted as an indication of such performance. Also, back tested performance results have certain inherent limitations and differs from actual performance because it is achieved with the benefit of hindsight.

