The potential for stock market “trouble” between now and the middle of 2022 is “high.” That is NOT a “call to action” or intended to be an “ominous warning that the sky is about to fall”.
It IS intended to be an alert to investors who have gotten used to stock prices going higher year after year that NOW is the time to prepare – both mentally and portfolio-wise for some downside volatility.
The Overview
As I discussed in a chapter in my book “Seasonal Stock Market Trends”, the U.S. stock market has demonstrated certain cyclical patterns across the course of the “average” decade.
They include:
The “Early Lull”: Roughly the first 2.5 years of the decade witness some downside volatility, particularly when a decade begins with a Presidential Election year (1900, 1920, 1940, 1960, 1980, 2000, 2020 – more in moment)
The “Mid-Decade Bulge”: Particularly between October Year “4” and .March Year “6”
The “Year 7-8 Decline”: Years “7” and/or “8” of the decade often witness some meaningful downside volatility
The “Late Rally”: Decades tend to see the stock market finish strong
For examples see Figures 3 and 4 in this article.
We will focus on “The Early Lull”. But first let me tell you why I am dwelling on this right now.
The World According to Jay
First, I don’t dispense advise/recommendations/predictions etc. What follows is just “my current thoughts” on the market – nothing more, nothing less:
* The “trend” of the stock market is bullish
* ”Momentum” is bullish
* The stock market is extremely “overvalued”
* “Seasonality” suggests a significant decline is quite possible/likely between now and the middle of 2022
A little more info:
*Trend: All the major averages are above their respective long-term moving averages. This is the definition of an uptrend
*Momentum: See this article
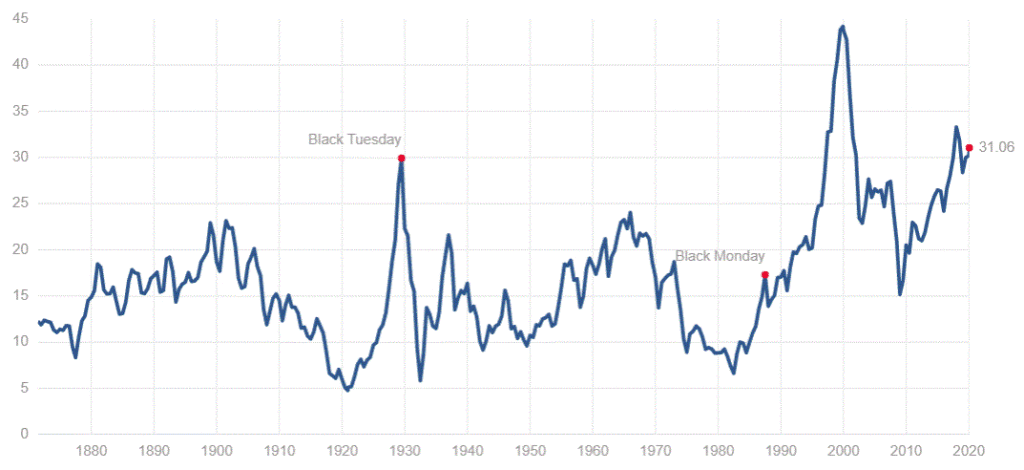
*Overvalued: See the Shiller PE ratio in Figure 1 compared to historic readings. While valuation is NOT a good timing indicator it DOES alert us to the fact that the next bear market will likely be one of the painful kind

Figure 1 – Shiller PE Ratio (Courtesy: https://www.multpl.com/shiller-pe )
Seasonality: Let’s take a closer look at “The Early Lull” in previous decades that started with a presidential election year. This article is essentially a follow-up to this article
The Early Lull
The four-year election cycle typically (though obviously not always) sees weakness in the first two years after an election and strength in the pre-election and election years. For this reason, it appears to make a difference if a decade starts with a presidential election year (1920, 1940, 1960, 1980, 2000, 2020) versus a mid-tern election year (1910, 1930, 1950, 1970, 1990, 2010). Since 2020 is a presidential election year we will focus on the former.
From December 31st of Year “9” of the previous decade through June 30 of Year “2” of the current decade we will measure:
*Net price % +(-): The next price gain or loss over the full 30 months
*Maximum % Gain from Start: Measures the highest gain achieved from Dec. 31 of Year “9”
*Maximum % Drawdown from Start: Measures the largest decline from Dec. 31 of Year “9”
*Maximum % Peak-to-Valley Drawdown from any peak: Measures the largest decline from any peak during the 2.5-year period

Figure 2 – Dow during 1st 2.5 years of decades starting with a presidential election year
NOTE: Remember that the numbers in Figure 2 are generated using month-end closing prices only, so the actual maximum gains and losses may be larger than what is indicated using only month-end measurements.
Here is the key takeaway from Figure 2: A drawdown of some proportion well beyond what investors have been conditioned to deal with recently may well unfold between now and the middle of 2020.
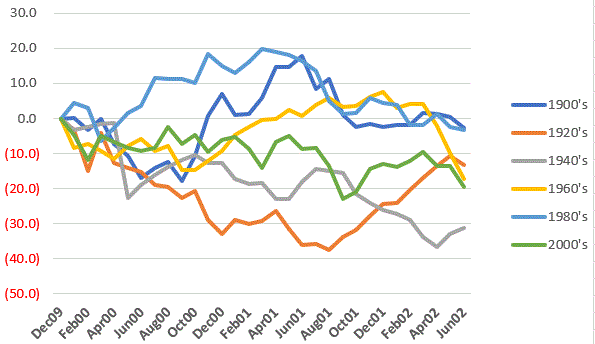
Figure 3 displays the Dec 31 Year 9 through Jun 30 Year 2 for the periods shown in Table 6. As you can see there is no “typical” performance. Sometimes things are just bad from start to finish, and other times the market does reasonably well for awhile (3 of the 6 showed a 12-month gain at the end of Year “0”) before trouble kicks in.

Figure 3 – Dow % +(-) during first 2.5 years of decades starting with a presidential election year
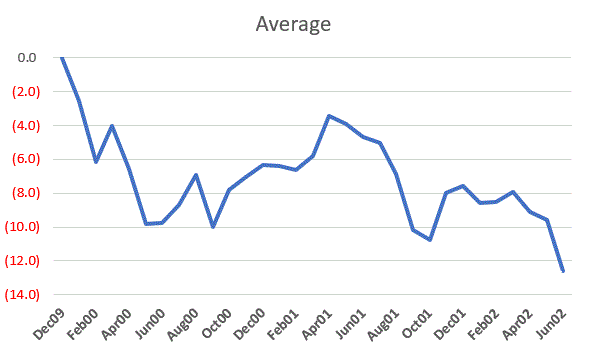
For what it is worth, Figure 4 displays the “Average” performance of the 6 periods displayed in Figure 2.

Figure 4` – Average Dow % +(-) during first 2.5 years of decades starting with a presidential election year
Summary
The danger at the moment is that investors are so used to “easy money” that the next 5% drawdown may well “feel” like a 20% drawdown and a 20% may throw a lot of investors completely for a loop.
The relevant question is “how will you mitigate this risk”? The time to start contemplating and planning is now.
Jay Kaeppel
Disclaimer: The information, opinions and ideas expressed herein are for informational and educational purposes only and are based on research conducted and presented solely by the author. The information presented does not represent the views of the author only and does not constitute a complete description of any investment service. In addition, nothing presented herein should be construed as investment advice, as an advertisement or offering of investment advisory services, or as an offer to sell or a solicitation to buy any security. The data presented herein were obtained from various third-party sources. While the data is believed to be reliable, no representation is made as to, and no responsibility, warranty or liability is accepted for the accuracy or completeness of such information. International investments are subject to additional risks such as currency fluctuations, political instability and the potential for illiquid markets. Past performance is no guarantee of future results. There is risk of loss in all trading. Back tested performance does not represent actual performance and should not be interpreted as an indication of such performance. Also, back tested performance results have certain inherent limitations and differs from actual performance because it is achieved with the benefit of hindsight.

