The month of September has a history of being unkind to electronics and semiconductor stocks. Figure 1 displays the “growth” of $1,000 invested in ticker FSELX (Fidelity Select Electronics) ONLY during the month of September since 1985.
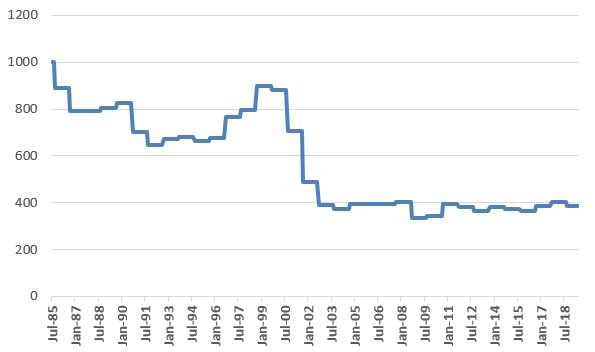
Figure 1 – Growth of $1,000 invested in ticker FSELX ONLY during September (1985-2018)
In a way, Figure 1 is somewhat misleading. The first reaction in most people’s mind is “Wow, this sector is a disaster in September.” And in a way it is. But that is due mostly to the fact that there have been some disastrous September’s along the way (most notably 2000 to 2002). In reality, FSELX has been “up” 47% of the time during the month of September, so it is only slightly worse than a coin flip. And it is “so far, so good” for September of 2019, with FSELX up almost +8% so far for the month. But will it last?
For the Skeptics
Figure 2 displays a chart of ticker SMH (VanEck Vectors Semiconductors).
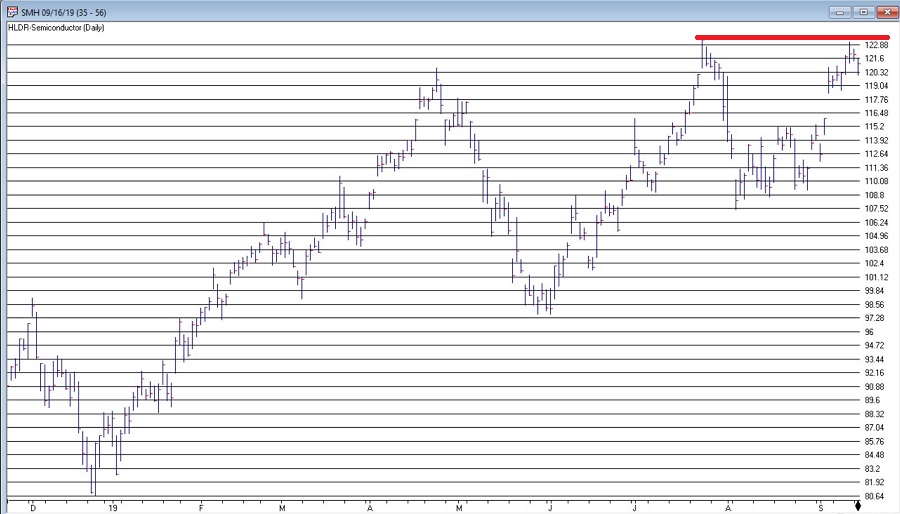
Figure 2 – Ticker SMH (Courtesy AIQ TradingExpert)
Some traders will look at this chart and see a ticker on the verge of breaking out to a new high. Others will look at the same chart and see a double or triple top – or possibly a head-and-shoulders formation forming. The discussion that follows is targeted to the latter group.
One of the great paradoxes of trading is that trying to pick “the top” in anything is, a) typically a mistake, and b) potentially lucrative. So, doing so is only for people who:
*Are smart enough to risk a little for the chance to make a lot
*Have the discipline to follow a plan
*Aren’t going to carry a lot of baggage around with them if they are wrong
These qualifiers reduce the target group even more. But for those “still standing”, a hypothetical trade (not a recommendation, just an example of “one way to play”)
*Buy SMH Nov15 121 put
*Sell SMH Nov15 115 put
The particulars appear in Figure 3 and the risk curves in Figure 4
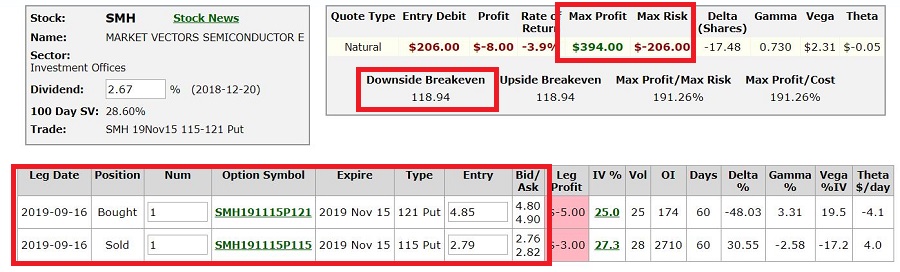
Figure 3 – SMH bear put spread
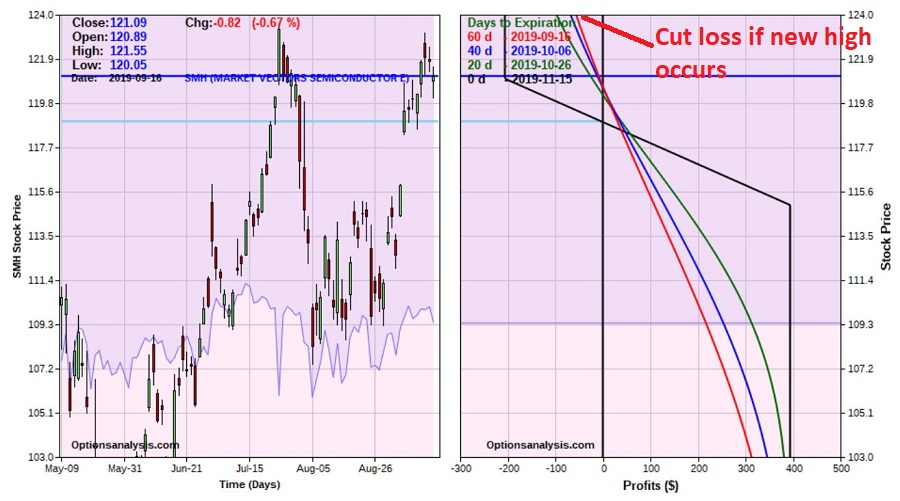
Figure 4 – Risk curves for SMH bear put spread
Mathematically speaking, this trade risks $206 for the chance to make $394. But here is the twist. This trade is a bet on SMH NOT breaking out to the upside. Ipso facto if it DOES break out to a new high, the basis for the trade evaporates and a trader (at least in my little world of hypothetical trades) MUST exit and cut his or her loss.
A closer look at Figure 4 reveals that if SMH hits $124 a share sooner than later (looking at the green, blue and red risk curves lines at the top of Figure 4) the expected loss is roughly -$100 or less. So, risk management for this trade might go something like this:
As long as price is below $124 the trader can “let it ride”. If SMH happens to decline and becomes oversold (using whatever method an individual trader might use to make that determination) the trade can either sell and tale his or her profit, or potentially adjust the trade to lock in a profit and let it ride a little longer.
Summary
For the record, I am not advocating a bearish position in SMH. I have simply highlighted that:
*The shares could be forming a multiple top
*Seasonally, September can be rough for electronics/semiconductors
*For a trader with discipline it is possible to enter a low dollar risk trade to take advantage if in fact SMH does go south from here.
*There is also a built-in “Uncle” point (i.e., some point above the recent high of $123.56)
The main thing to remember about a trade like this is the need for vigilance. If SMH breaks out to a new high, our hypothetical trader:
*MUST cut his or her loss, and
*MUST NOT arbitrarily say “well, maybe I’ll give it just a little more room.
And remember, this could happen 5 minutes after the trade is entered.
Jay Kaeppel
Disclaimer: The data presented herein were obtained from various third-party sources. While I believe the data to be reliable, no representation is made as to, and no responsibility, warranty or liability is accepted for the accuracy or completeness of such information. The information, opinions and ideas expressed herein are for informational and educational purposes only and do not constitute and should not be construed as investment advice, an advertisement or offering of investment advisory services, or an offer to sell or a solicitation to buy any security.

