I believe that when it comes to the financial markets it is important to “do your own thinking.” Except of course when your own thinking is pretty muddled and you find yourself unable to make heads nor tails of the myriad goings on across the financial spectrum. Then it’s pretty helpful to review clear-headed (and straightforward) thinking from others.
To wit:
Junk Bonds
Because junk bonds are highly correlated to the fortunes of less creditworthy companies, they can (but don’t always) serve as a “canary in the coal mine” for the overall economy. Figure 1 is from this article and highlights the fact that junk bonds are reaching a critical “Which way from here” juncture.
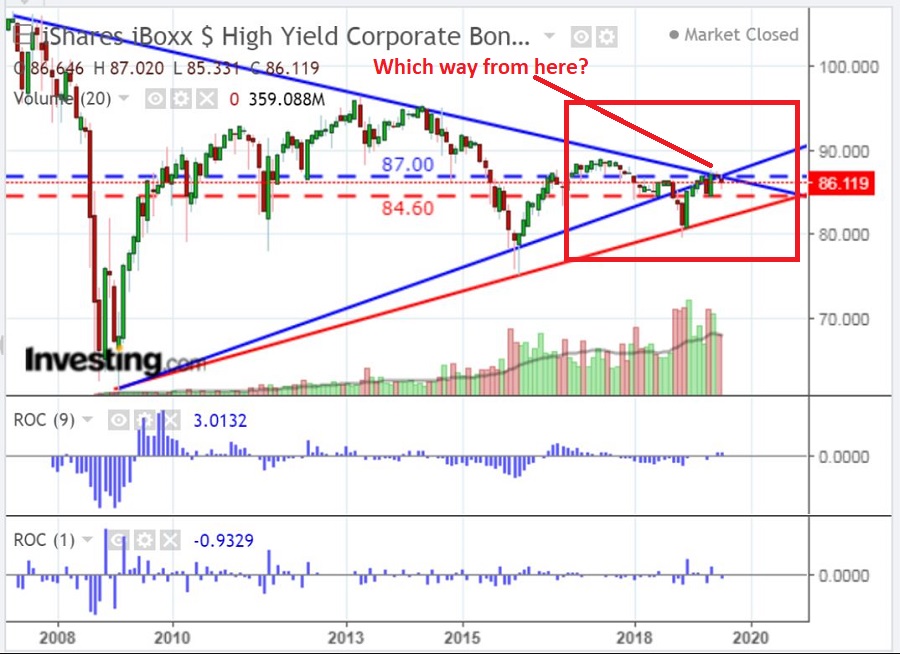 Figure 1 – Ticker HYG nearing a critical juncture (Source: StrawberryBlondMarketSummary)
In the simplest terms possible, for the stock market – and as a potential signpost for the overall economy – a breakout to the upside is “Good”, a breakout to the downside is “Bad”.
The Yield Curve
If you are just learning now that the treasury yield curve has become inverted, um, welcome back from your coma and congrats on your recovery. I almost hesitate to even talk about the yield curve because, I mean, what can I say that the previous 181 million articles (Source: Google.com) haven’t already said? So, let me simply point out two things using other people’s graphics (and excellent articles).
On one hand there is cause for concern, as highlighted in Figure 2 which is from this article.
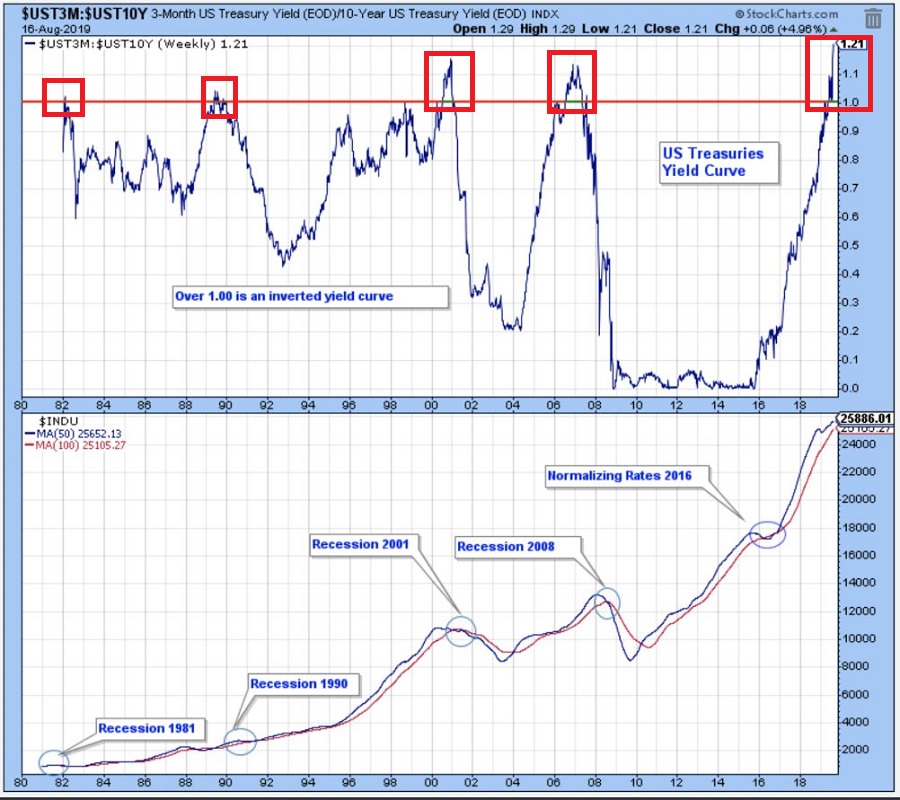 Figure 2 – 10-year treasury versus 3-month T-bill inversion has historically pointed toward economic recession (HeadlineCharts.Blogspot.com)
On the other hand, the idea that an inverted yield curve is some sort of immediate reason to panic is dispelled in this article and in Figure 3 from said article below.
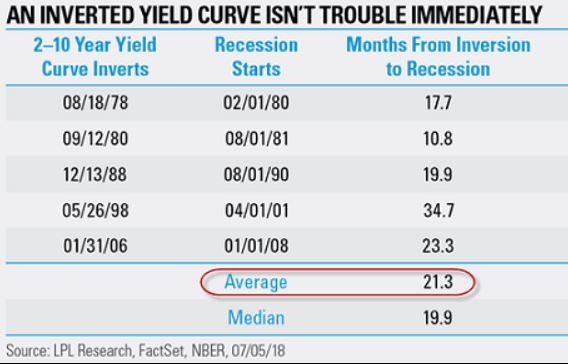 Figure 3 – Lead time of 10-yr-2yr inversion to recession (Source: DisciplinedInvesting.Blogspot.com)
In a nutshell, there is typically a lot of lead time between “inversion” and “recession.” So maybe put off your plans to panic for another year or so.
Uranium
And now in the immortal words of Monty Python’s Flying Circus, “and now for something completely different.” Figure 4 from this article highlights the action of Uranium futures over the past several years. The key thing to note is that the futures contract price bottomed out over 2 and half years ago and has been trading sideways (basing?) ever since.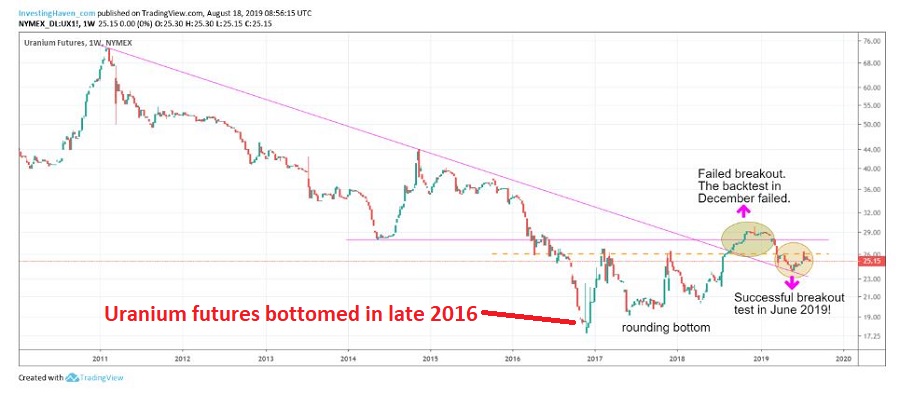 Figure 4 – Uranium futures (Source: InvestingHaven.com)
On the other hand, the Uranium ETF (ticker URA) has been plunging lately to new lows as seen in Figure 5.
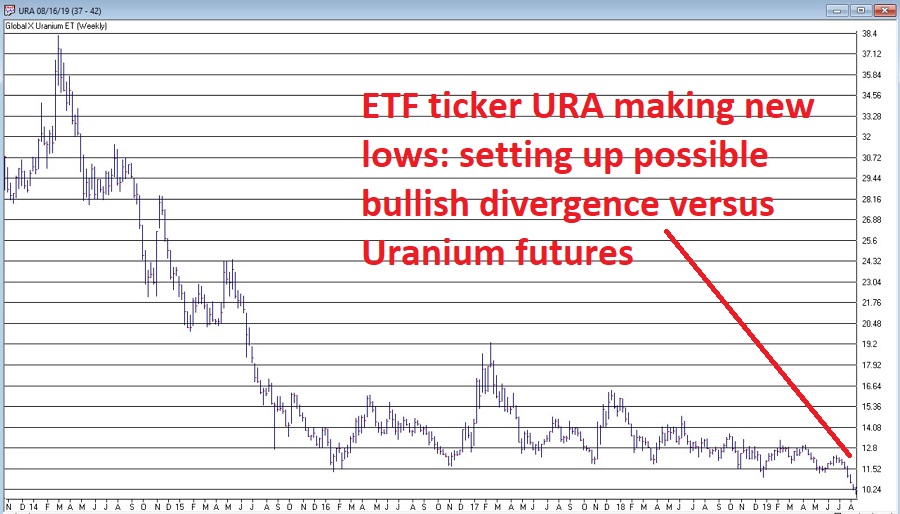 Figure 5 – ETF Ticker URA (Courtesy AIQ TradingExpert)
I for one will never recommend trying to “pick the bottom” in anything that is firmly in the midst of a long-term decline (ala URA). So, I am not recommending that anyone rush out and pile into URA. I merely wish to point out, that if the futures market is right vis a vis ticker URA (and for the record, it is not always), URA may offer a pretty good buying opportunity (if and when it ever stops collapsing).
Summary
My thanks to all of the authors of the articles linked above for helping write this article for me. If you like the one’s linked here also be sure to visit http://www.McVerryReport.com for more of the same.
Jay Kaeppel
Disclaimer: The data presented herein were obtained from various third-party sources. While I believe the data to be reliable, no representation is made as to, and no responsibility, warranty or liability is accepted for the accuracy or completeness of such information. The information, opinions and ideas expressed herein are for informational and educational purposes only and do not constitute and should not be construed as investment advice, an advertisement or offering of investment advisory services,

