Once you have been in this business for a while, you start to think you have heard it all. Then of course, you are reminded that you are wrong. Which can be a little unsettling – kind of the “I am an Old Dog, and this is a New Trick” challenge.
Anyway, in this article from BullMarkets.co they reference the “Boom/Bust Barometer” tracked by well-known market analyst Ed Yardeni (by the way, I highly recommend his book). This barometer “takes the CRB Raw Industrial Index and divides it by Initial Jobless Claims. This is essentially using commodities vs. labor market as a means to gauge the overall health of the economy.”
The article also contained a link to a spreadsheet with the data. The file contained month-end readings for the Boom/Bust Barometer (or BBB for short) going back to May 1981. A few notes:
*From doing a little more digging, I believe Mr. Yardeni tracks this on a daily basis, and that there are people who use it as an active market timing tool. I have no knowledge of the steps they take in order to do that
*For our purposes here all we have is the month-end reading, so we will go with that
*What follows is NOT a “recommended” trading strategy, it is presented solely as a simple example of one potential way to use the data as a bullish/bearish “confirmation tool”
Figure 1 displays the month-end reading for the BBB along with a 48-month exponential moving average. As you can see, sometime the data trends “up” – i.e., the month-end value is above the moving average, and vice versa.
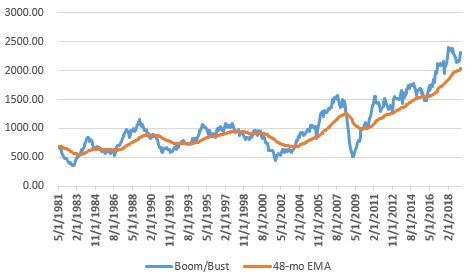
Figure 1 – Yardeni Boom/Bust Barometer month end values (blue) with a 48-month EMA (orange); 1981-2019
Figure 2 displays the difference between the two lines in Figure 1 (positive means the BBB is above its 48-month EMA and is “trending higher” and negative means the BBB is below its 48-month EMA and is trending lower) along with the month end price for the S&P 500 Index. From a cursory glance it appears that the BBB does a good job of being on the right side of the market. This approach would have suggested being out of the market during most all of the 2000-2002 and 2008-2009 bear markets.
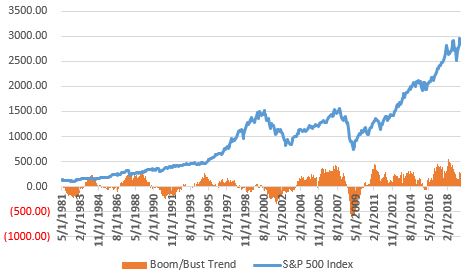
Figure 2 – S&P 500 Index (blue) with Boom/Bust Barometer minus 48-month EMA (orange); 1981-2019
Figure 3 displays two equity curves:
*The blue line represents the growth of $1,000 invested in the S&P 500 Index (using month-end price data) when the BBB is ABOVE its 48-month EMA
*The orange line represents the growth of $1,000 invested in the S&P 500 Index (using month-end price data) when the BBB is BELOW its 48-month EMA
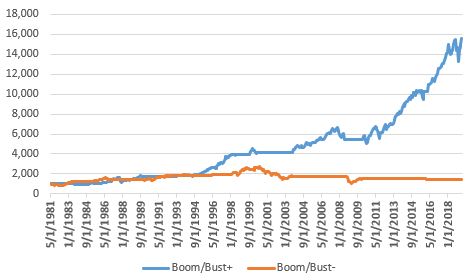
Figure 3 – Growth of $1,000 invested in S&P 500 Index when Boom/Bust trend is “+” (blue) versus when Boom/Bust trend is “-” (orange); 1981-2019
Results:
*When the BBB was in an “uptrend” the S&P 500 Index gained +1,460%
*When the BBB was in a “downtrend” the S&P 500 Index gained +42%
Notes:
*As a standalone strategy (which again, is not recommended) this “strategy” would have underperformed a buy and hold approach. However, as a “perspective” indicator it appears to offer some potentially good value.
*As you can see in Figure 4, this simplistic approach to using BBB is still well into positive territory, i.e., bullish – or at the least, not yet flashing a bearish warning ala 1981, 1990, 2000 and 2008.
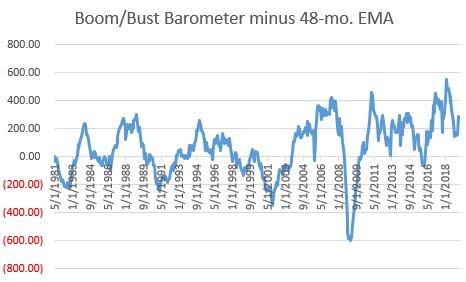
Figure 4 – Boom/Bust Barometer minus 48-month EMA; 1981-2019
Summary
It should be pointed out that the “method” presented here is almost certainly NOT the way Mr. Yardeni intended this indicator to be used. So if you do not see any real value in what you just saw, don’t think any less of the indicator itself.
But I do think I will keep an eye on this one for a while. My thanks to Ed Yardeni and www.BullMarket.co for teaching this Old Dog a New Trick.
Woof.
Jay Kaeppel
Disclaimer: The data presented herein were obtained from various third-party sources. While I believe the data to be reliable, no representation is made as to, and no responsibility, warranty or liability is accepted for the accuracy or completeness of such information. The information, opinions and ideas expressed herein are for informational and educational purposes only and do not constitute and should not be construed as investment advice, an advertisement or offering of investment advisory services, or an offer to sell or a solicitation to buy any security.


Dr Yardeni’s is an incredible website packed with charts and resources for all to see and use.
Hi Jay, thanks for the mention.
If you hold bonds instead of cash when Boom/Bust is positive, the returns would increase since this strategy spends quite a bit of time in cash.
I’m always sceptical with this sort of stuff. There are so many indices and various performance metrics that are published. A convincing argument can be built for all sorts of combinations. How many combos were made from the wealth of available of data before these two measures were decided upon? What was the rational with using the 48 month EMA? I see potential for over optimisation with both questions.
I don’t see the value but I do appreciate the post.
Ryan, thanks for the comment and you do make a valid point. I don’t know how Mr. Yardeni came up with the Boom/Bust Cycle and there is nothing “magic”
about 48 months (but for an economic indicator it seems as logical as anything else). For the record I just started following this recently and I did not intend for it to be a “buy/sell” signal but rather more of a “perspective” indicator. In my mind it looks like a potentially useful “confirmation” tool if things start to go south (although I do believe Mr. Yardeni employs it differently, as a more active shorter-term indicator – but I don’t know the specifics). Take Care, Jay
Your site is an awesome source of information. I bought your option book and seasonality of the markets also. I would like to thank you for taking the time to share your insight.
Janaka, Thank You, I appreciate the kind words. Jay