But I repeat myself. Also, as it turns out, the real question may be “when YYY?” But of course, to get the full picture the first question to ask and answer is “what YYY?”
Ticker YYY
Ticker YYY is an ETF created in 2011 for the sole purpose of offering a product with a “high yield”, i.e., a high dividend yield. As stated on the www.YieldShares.com website: “The YieldShares High Income ETF seeks to provide investment results that, before fees and expenses, correspond generally to the price and yield performance of the ISE High Income™ Index. The Index is comprised of 30 closed-end funds (CEFs) ranked highest overall by the ISE in three criteria: fund yield, discount to net asset value and liquidity.”
First the good news: As I write, the yield on ticker YYY is a whopping 8.94%, which instantly gets the attention of yield hungry investors. The bad news is that – under that age-old category of “there is no free lunch”, that high yield comes at price. There is a lot of volatility in the price of the shares and as a buy and hold investment it leaves a lot to be desired. Figure 1 displays the price action since inception.
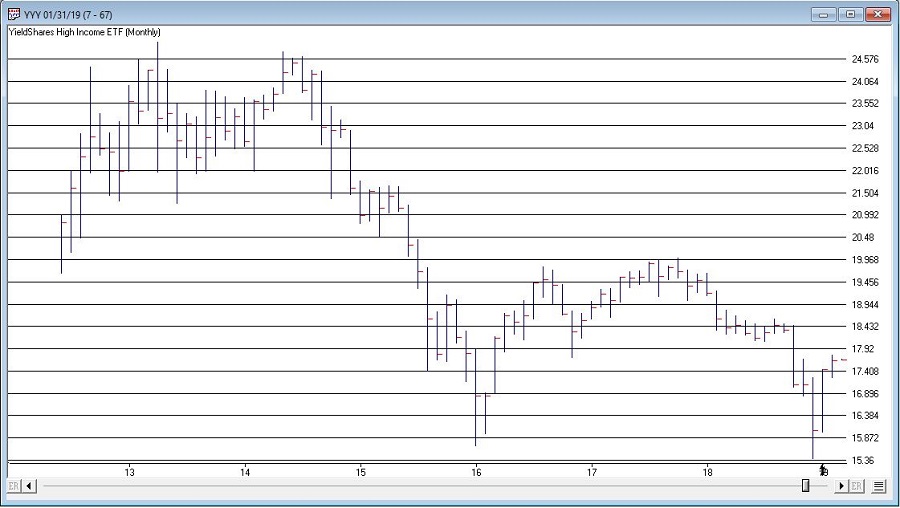 Figure 1 – Ticker YYY price performance (Courtesy AIQ TradingExpert)
Average 12 month % return has been +6.4% with a maximum drawdown (using monthly total return data) of -22.4%. Not so hot.
A Seasonal Strategy for YYY
Ticker YYY has a relatively short history, so what follows is not a recommended strategy as much as it is “food for thought.” First note that YYY has a much higher correlation (roughly 62%) to the S&P 500 Index than it does to long-term treasuries (roughly 13%) or 7-10-year treasuries (roughly 13%).
The “strategy” below involves holding YYY ONLY during several months that are typically favorable for the stock market. Specifically:
*Hold ticker YYY ONLY during the months of January through April AND during the month of July
Figure 2 displays the growth of $1,000 invested ONLY during the five months listed above (blue) versus holding ticker YYY during ALL other months of the year (orange).
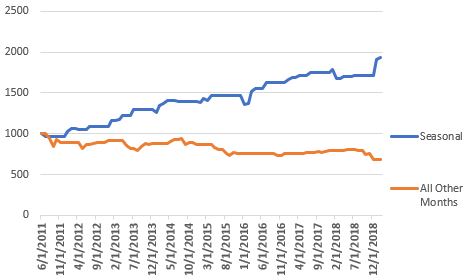
Figure 2 – Growth of $1,000 invested during Jan-Apr plus July (blue) versus all other months (orange); Jul 2011-Feb 2019
The difference is stark. The relevant numbers are:
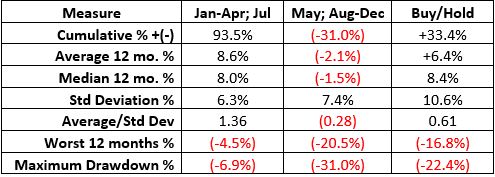
Figure 3 – Facts and Figures, Seasonal, Anti-Seasonal and Buy-and-Hold; Jul 2011-Feb 2019
Summary
Does YYY offer a high yield? It sure does. Is it a good investment? That is an entirely different question. In its roughly 7.5-year existence it has had a lot of ups and downs, a great deal of volatility and not a stellar total return when looked at on a buy-and-hold basis.
However, because it has a strong correlation to the stock market it does appear that there might a potential seasonal component that may be of value. The bottom line is that the blue equity curve line in Figure 2 is far more appealing than the volatile bar chart in Figure 1.
While this is not something that anyone should “jump into”, it may be something to keep an eye on for investors looking for strong yield without all of the volatility.
Jay Kaeppel
Disclaimer: The data presented herein were obtained from various third-party sources. While I believe the data to be reliable, no representation is made as to, and no responsibility, warranty or liability is accepted for the accuracy or completeness of such information. The information, opinions and ideas expressed herein are for informational and educational purposes only and do not constitute and should not be construed as investment advice, an advertisement or offering of investment advisory services, or an offer to sell or a solicitation to buy any security.


Does your cumulative percent number (+93.5%) include dividend income?
Yes. The data used was monthly total return data. Jay