Monthly Archives: March 2019

When Things Get Too Quiet

Traders are a silly bunch sometimes.  Sometimes they forget the basics like – markets go up, markets go sideways, markets go down, markets get quiet, markets get volatile, and so on.  And then when they get so used to something going one way or doing one thing for so long they start to think that that state of affairs will never end.  Like now.  In a variety of markets.

One way to tell when this is happening is to look at the implied volatility of the options on a given security.  When traders reach that “well, whatever” state of being it is typically accompanied by a decline in IV (The short lesson: all options have some time premium built into their price prior to expiration.  High IV means lots of time premium, low IV means very little time premium) as traders simply lose interest and start to figure that “nothing will ever happen” with that given security.

And of course, markets being what they are, very often they are wrong.

A Cross Section of the Blahs

The charts below display the price action for a variety of ETFs as well as the historical and current IV levels for the options on each.  The point should be self-evident.fxe iv
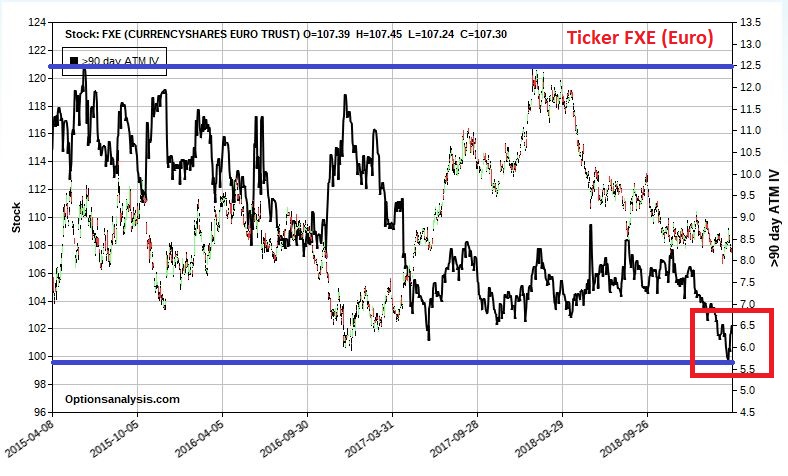
Figure 1 – Ticker FXE with IV (Courtesy www.OptionsAnalysis.com)

tlt iv
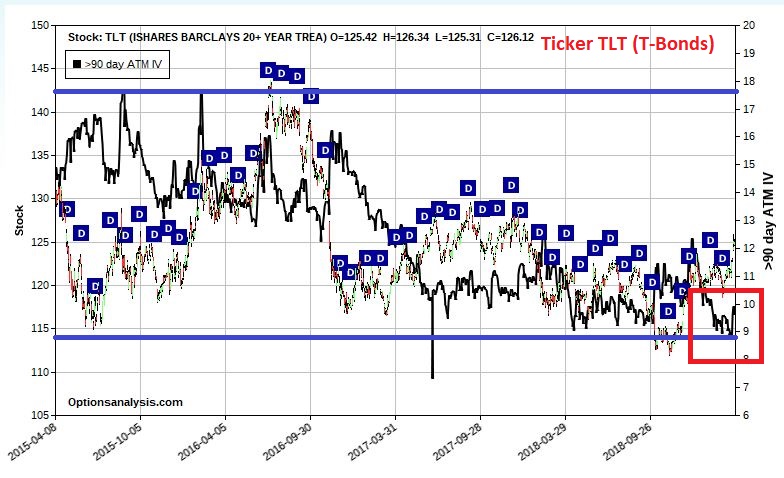
Figure 2 – Ticker TLT with IV (Courtesy www.OptionsAnalysis.com)

ung iv
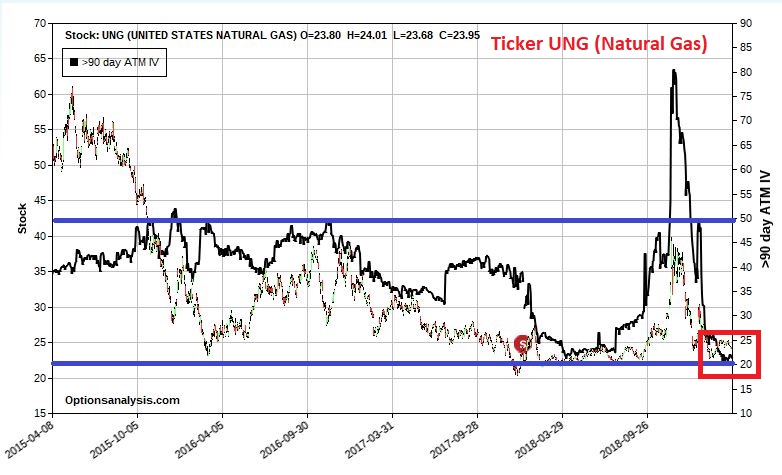
Figure 3 – Ticker UNG with IV (Courtesy www.OptionsAnalysis.com)

gld iv
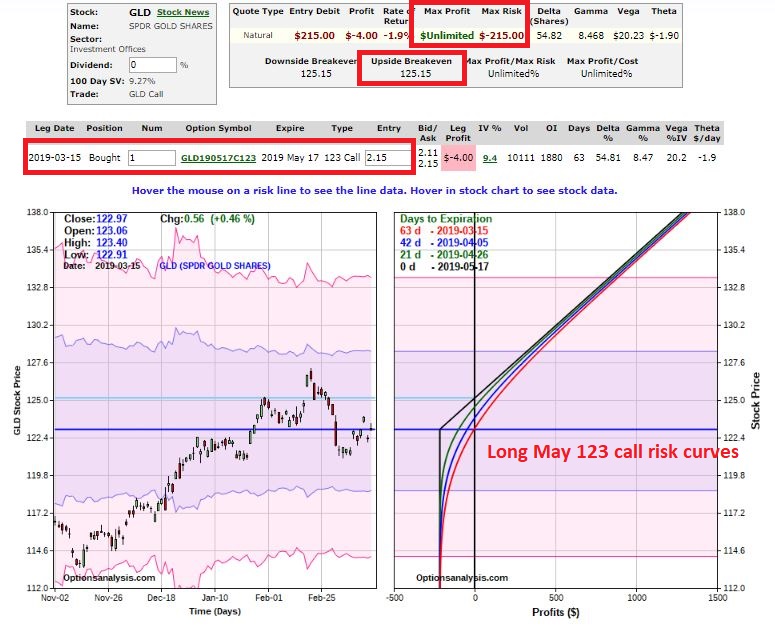
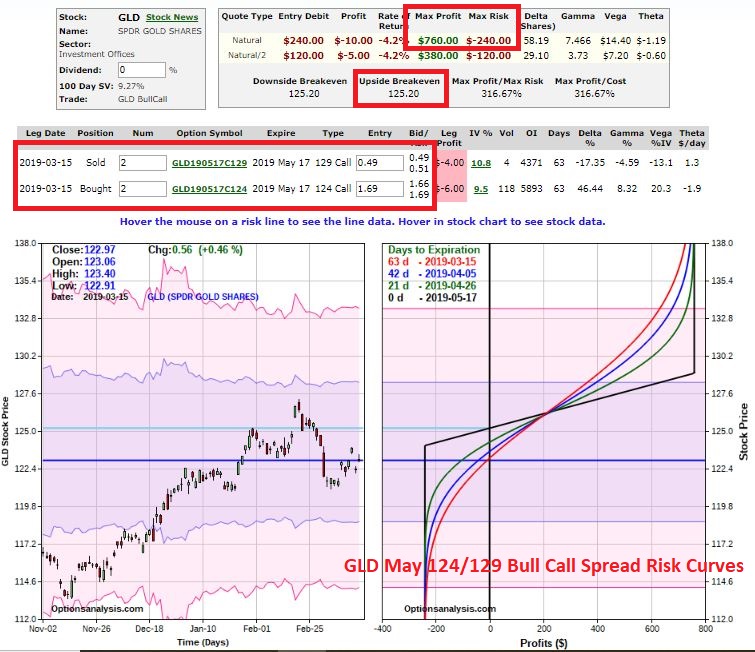
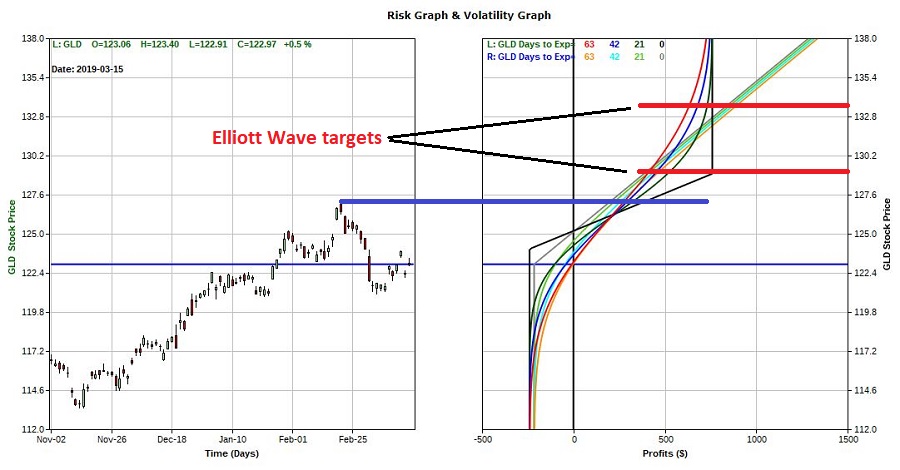
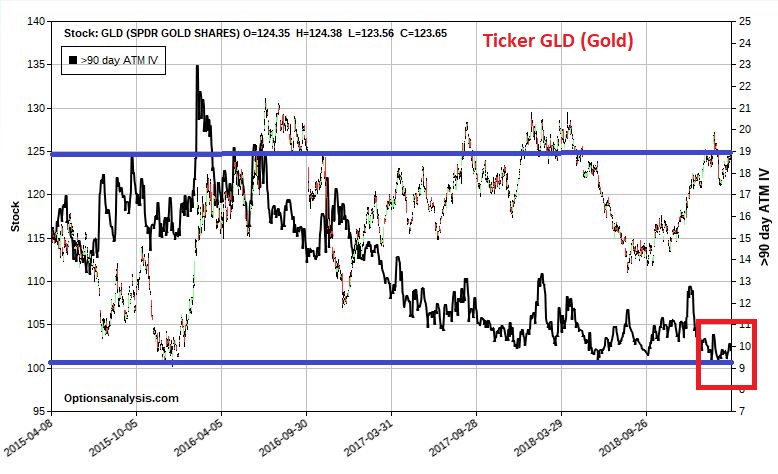
Figure 4 – Ticker GLD with IV (Courtesy www.OptionsAnalysis.com)

slv iv
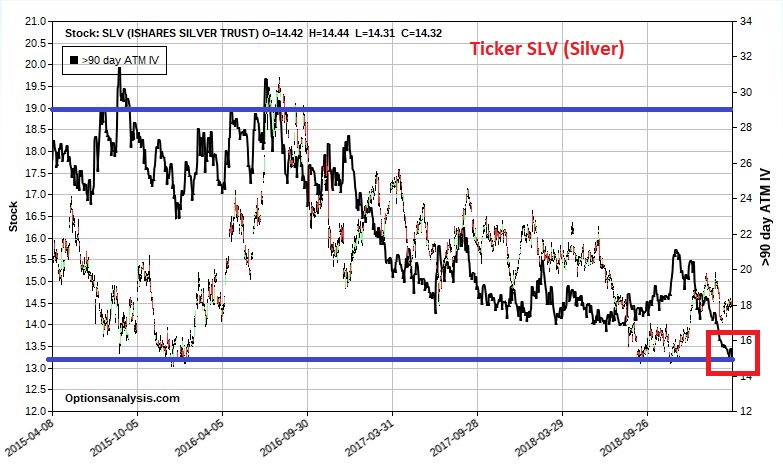
Figure 5 – Ticker SLV with IV (Courtesy www.OptionsAnalysis.com)

What should be obvious is that IV for these securities is extremely low – i.e., traders have determined that there is nothing going on in these tickers and there is no expectation for a pickup in volatility any time soon.

Now here are 3 things to note:

*I have no “predictions” to make for any of these, bullish or bearish

*When traders as a group get this complacent they are typically (though importantly, not always) wrong

*When IV is “low”, the options are “cheap”

So, from there we can make the following leap:

*Something surprising may be coming in these markets that will surprise traders

*We don’t know if the surprises will be to the upside or the downside

*We know that the options are cheap

There is an option strategy for that scenario.  It is called a “strangle”, which involves buying both a call and a put at the same strike price and waiting for the underlying security to make a meaningful move in one direction or the other.  Another alternative is the “strangle”, which involves buying a call and a put with different strike prices.

Some Examples

As always, the trades displayed below are NOT “recommendations”, only “examples.”  One thing to note:

*In the world according to me the “correct” range for straddles is options with 60 to 140 days left until expiration.

*Anything less and time decay can work against you heavily and there may not be enough time for the underlying security to make the move required to generate a profit.

*Beyond 140 days you often are dealing with less liquid options which can also be less price sensitive

In this case I am making an exception and going out a little further.  Two reasons for this:

*I have no idea if or when these tickers may actually make a significant move, so I want to give them a lot of time.

*The options are about as cheap as they have ever been, plus longer-term options are more sensitive to changes in volatility.  So, if volatility picks up these options may get more of a time premium “bump”.

fxe straddle
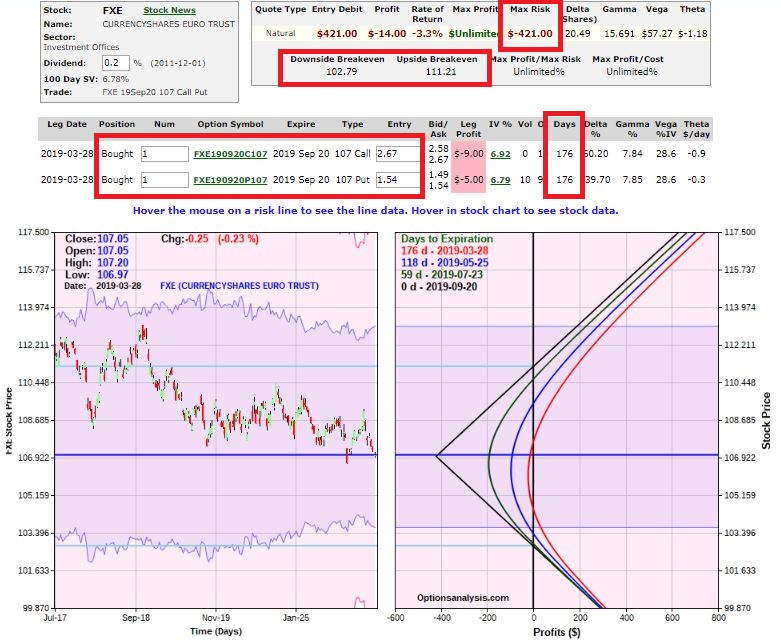
Figure 6 – FXE Sep 107 straddle (Courtesy www.OptionsAnalysis.com)

tlt straddle
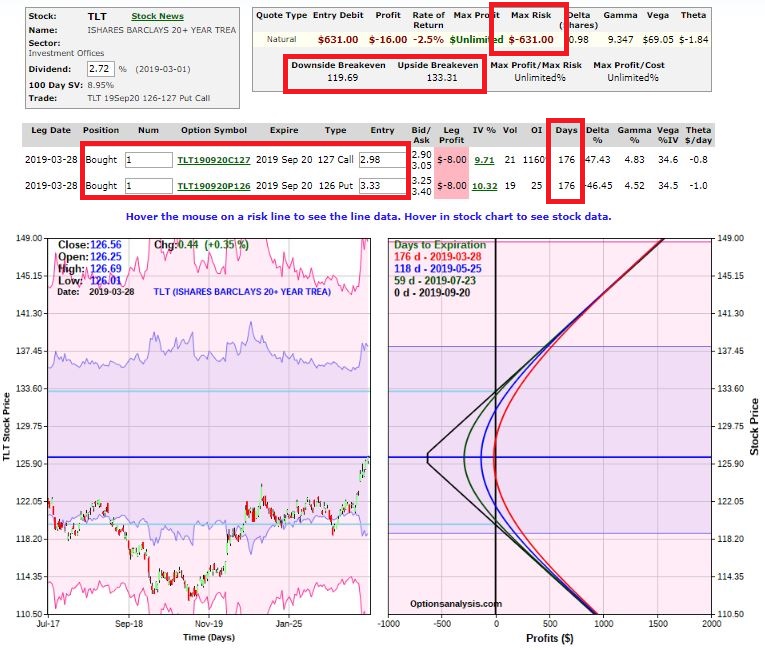
Figure 7 – TLT Sep 126-127 strangle (Courtesy www.OptionsAnalysis.com)

ung straddle
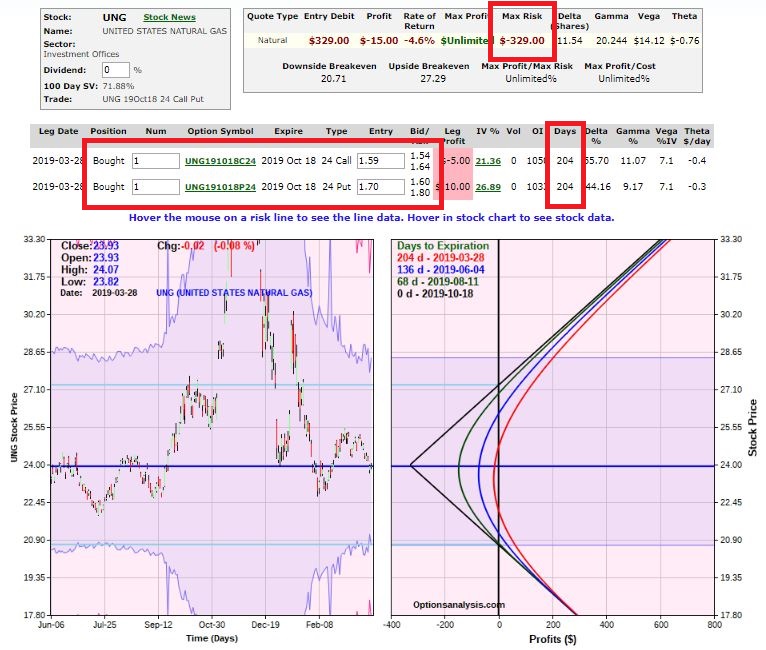
Figure 8 – UNG Oct 124 straddle (Courtesy www.OptionsAnalysis.com)

gld straddle
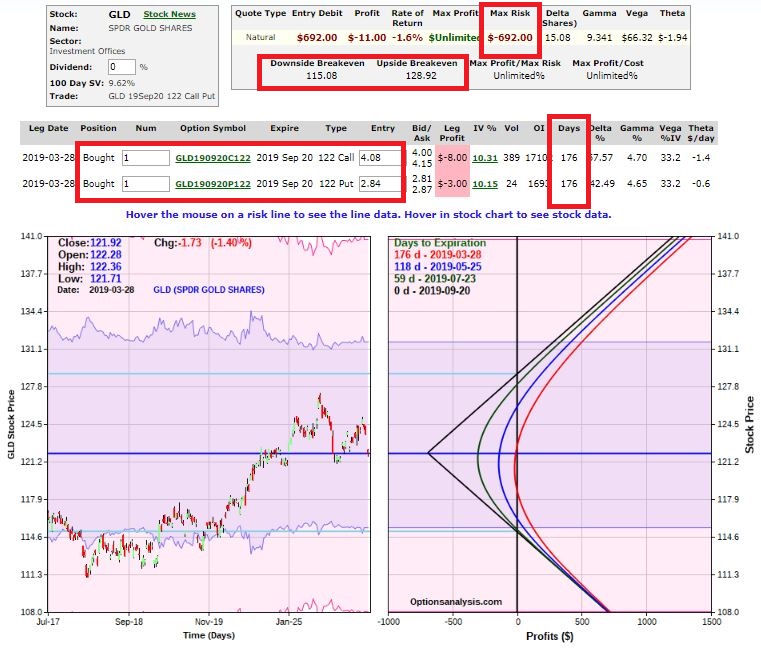
Figure 9 – GLD Sep 122 straddle (Courtesy www.OptionsAnalysis.com)

slv straddle
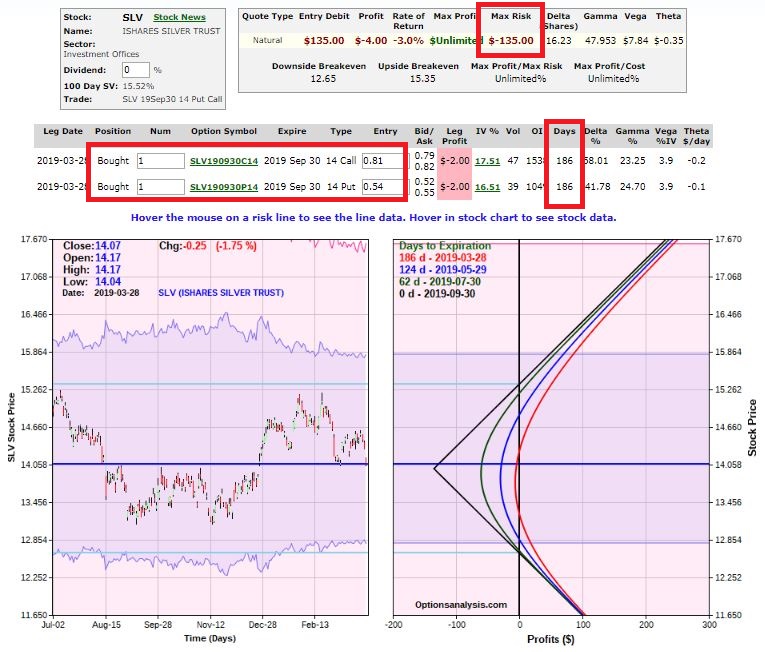
Figure 10 – SLV Sep 14 strangle (Courtesy www.OptionsAnalysis.com)

With all of the above:

*A significant up move or down move in price will generate a profit

*A continued sideways movement will likely generate a loss

*A sharp rise in implied volatility will help the trade by inflating the time premium built into the options.

Summary

Will the markets highlighted continue to drift or trade within a range between now and September/October?  It’s certainly possible.  Will the example trades highlighted generate a profit?  It beats me.  But that is not the point of this piece.

The point of this piece is simply to highlight:

*That low extremely low IV often highlights complacency and may be followed by more volatile than expected price action

*Options offer a way to play this situation

Jay Kaeppel

Disclaimer:  The data presented herein were obtained from various third-party sources.  While I believe the data to be reliable, no representation is made as to, and no responsibility, warranty or liability is accepted for the accuracy or completeness of such information.  The information, opinions and ideas expressed herein are for informational and educational purposes only and do not constitute and should not be construed as investment advice, an advertisement or offering of investment advisory services, or an offer to sell or a solicitation to buy any security.

Too Soon to Get Sweet on Sugar

One of my (admittedly, potentially foolish) beliefs is that commodities will outperform stocks again someday.  Possibly someday starting soon (roughly defined as anywhere from today to a year from today) and that the shift will be dramatic and last for a period of 3 to 8 years.

And no, I don’t think I could be any more vague.  But I haven’t really “taken the plunge” (i.e., shifted money from the stock market into commodities in any meaningful way) yet.  But I am keeping a close eye on things.  Rather than rattled off another 1,000 words to explain, I will simply refer you to Figure 1 that tracks the ratio of the S&P Commodity Index to the S&P 500 Index.

1Figure 1 – Commodities versus Stocks (Source: www.DailyReckoning.com)

History suggests that “the worm will (eventually) turn.”

Sugar

Let’s focus on one commodity for now.  Sadly, it’s one of my favorites (ranks right up there with coffee).  Sugar.  As you can see in Figures 2 and 3, sugar has a history of contracting in price over a period of time and then alternately – and please excuse my use of the following overly technical terms – “swooping” or “soaring”.2Figure 2 – Sugar 1970-1998 (Courtesy ProfitSource by HUBB)

3Figure 3 – Sugar 1998-2019 (Courtesy ProfitSource by HUBB)

Sugar can be traded either in the futures market (each full one-point movement in price equates to $1,120 in contract value).  An alternative for “normal people” is ticker CANE which is the Teucrium Sugar ETF which trades like shares of stock.  See Figure 4.4Figure 4 – ETF Ticker CANE (Courtesy AIQ TradingExpert)

As you can see, sugar has been “contracting” in price of late.  Does this mean it is reading to “swoop” or “soar”?  Possibly.  But for those who want to play the bullish side, it is probably a bit too soon to dive in.

Seasonality in Sugar

Figure 5 displays the annual seasonal trend in sugar.  It should be noted that you should NOT expect every year to follow this trend.  It is a display of previous historical tendencies and NOT a roadmap.5Figure 5 – Sugar Annual Seasonal Trend (Courtesy Sentimentrader.com)

Still, the primary point is captured nicely in:

Jay’s Trading Maxim #92: One of the keys to long term success is committing capital where the probabilities are (or a least appear to be) in your favor.

February through April is NOT that time for anyone looking to play the long side of sugar.

Figure 6 displays the cumulative results achieved by holding long one sugar futures contract ONLY during the months of February through April every year starting in 1970.

6

Figure 6 – Cumulative $+(-) holding long sugar futures Feb, Mar, Apr every year since 1970

Some things to note regarding sugar Feb through Apr:

*UP 18 times

*DOWN 31 times

*Average gain = +$2,201

*Average loss = (-$3,377)

*Largest gain = +$6,630 (1974)

*Largest loss = (-$18,424) (1975)

Summary

The point IS NOT to argue that sugar is doomed to plunge between now and the end of April, nor even to argue that it cannot rally strongly between now and then – because it can.

The point IS to merely point out that the odds do not presently favor the bulls, which means – well, see Trading Maxim #92 above.

Jay Kaeppel

Disclaimer:  The data presented herein were obtained from various third-party sources.  While I believe the data to be reliable, no representation is made as to, and no responsibility, warranty or liability is accepted for the accuracy or completeness of such information.  The information, opinions and ideas expressed herein are for informational and educational purposes only and do not constitute and should not be construed as investment advice, an advertisement or offering of investment advisory services, or an offer to sell or a solicitation to buy any security.

Cheap Speculation in GLD

Few “investment vehicles” attract more attention than gold.  The shiny stuff.  The precious metal.  The store of value.  Yada, yada, yada.

All my adult life I have seen the articles purporting that gold will be the ultimate asset when “disaster finally strikes.”  And who knows, maybe they’re right.  Still, when I picture myself trying to trade a gold bar for a bag of groceries I am not so sure.  Plus, my own belief is that “(if and) when it all hits the fan” the three most valuable commodities will be canned food, shotgun shells and cabins in the woods.  But that’s just me.

Ticker GLD

Figure 1 displays ticker GLD (an ETF that purportedly tracks the price of gold bullion) with the daily Elliott Wave count generated by ProfitSource by HUBB.  As you can see, it is suggesting a potential price move higher may be in the offing.

1Figure 1 – Ticker GLD with Elliott Wave count (Courtesy ProfitSource by HUBB)

Figure 2 displays the annual seasonal trend for gold from www.sentimentrader.com.  As you can see the months ahead are not “gangbusters” bullish.  However, I guess the key point in my mind is that it is not bearish.  So, a bullish move would not have to “swim upstream” so to speak.2Figure 2 – Gold annual seasonal trend (Courtesy Sentimentrader.com)

OK, the usual caveats.  I am not professing that I am bullish on GLD nor am I “recommending” the trades that follow.  The trades are presented as an example of different ways to play a potentially bullish situation while exposing oneself to only a low dollar risk.

Figure 3 displays the risk curves for buying 1 May GLD 123 call @ $2.15.  The key things to note are:

*A maximum dollar risk of -$215

*Unlimited profit potential

*A breakeven price of $125.15 for GLD shares (trading at $122.97 as I type)

3Figure 3 – GLD May 123 call (Courtesy www.OptionsAnalysis.com)

Figure 4 displays a bull call spread for GLD

*A maximum dollar risk of -$240

*Maximum profit potential of +$760 (if GLD reaches $129 a share)

*A breakeven price of $125.20 for GLD shares (trading at $122.97 as I type)

4Figure 4 – GLD May 124/129 Bull Call spread  (Courtesy www.OptionsAnalysis.com)

At first blush the lower cost and breakeven price plus the unlimited profit potential makes the long call position attractive.  However, a close examination of Figure 5 (which overlays the risk curves for the two trades) reveals that the bull call spread may be more attractive at any price above roughly $126 through roughly $131 a share for GLD.

5Figure 5 – Overlay of long call AND bull call spreads for GLD (Courtesy www.OptionsAnalysis.com)

Summary

The key points:

*The daily Elliott Wave count from ProfitSource by HUBB (and a whole lot of diehard gold bugs out there) are suggesting gold may move higher soon.  There are ways to “make the play” without risking large sums of capital.

*I personally am not offering any opinion; however, I have highlighted a couple of ways that a trader might play a bullish opinion on gold for less than $250 – i.e., without going out and buying actual physical gold, or assuming the risk of going long gold futures, or even ponying up roughly $12,300 to buy 100 shares of GLD.

How it all works out, only time will tell.

Jay Kaeppel

Disclaimer:  The data presented herein were obtained from various third-party sources.  While I believe the data to be reliable, no representation is made as to, and no responsibility, warranty or liability is accepted for the accuracy or completeness of such information.  The information, opinions and ideas expressed herein are for informational and educational purposes only and do not constitute and should not be construed as investment advice, an advertisement or offering of investment advisory services,

Utilities and Natural Gas – A Love Story(?)

Well it’s not the most obvious pairing in the world.  Nor would I make any claim that it is the greatest pairing in the world.  But under the category of “Is this any way to invest?”, the answer is “Well, it’s one way.”

The Test

We will make this as simple as possible:

*If the current month is January, February or December hold Utilities

*If the current month is March or April hold natural gas

*For all other months hold a money-market fund

Not exactly exciting to say the least.

The Funds

*For utilities we will use ticker FSUTX

*For natural gas we will FSNGX

*For money market we will use ticker VMMXX

1

Figure 1 – “System” Calendar

The Results

Figure 2 displays the growth of $1,000 invested using the rules above (utilities held Dec through Feb, natural gas held March and April, money-market held May through November) versus buying and holding the S&P 500 Index starting in Jan 1993.

2

Figure 2 – Growth of $1,000 invested using our Utility/Natural Gas strategy

Figure 3 displays some comparative numbers.

3

Figure 3 – Comparative Results

Summary

So, is this really a viable “system?”  That’s not for me to say.   The “system” has certain favorable qualities (simple, beat the S&P over time, much less volatile and with lower drawdowns than the overall market) but also certain negatives (out of the market 7 months a year, can get left behind in a strong bull market, 100% focused in one sector 5 months a year).

Still, the results do generate some interesting food for thought.  Something to chew on anyway…

Jay Kaeppel

Disclaimer:  The data presented herein were obtained from various third-party sources.  While I believe the data to be reliable, no representation is made as to, and no responsibility, warranty or liability is accepted for the accuracy or completeness of such information.  The information, opinions and ideas expressed herein are for informational and educational purposes only and do not constitute and should not be construed as investment advice, an advertisement or offering of investment advisory services, or an offer to sell or a solicitation to buy any security.

Utilities at the Crossroads

A lot of eyes are firmly fixed on Utilities at the moment.  And for good reason.  As you can see in Figure 1, the Dow Jones Utilities Average is presently facing a key resistance level.  If it breaks out above the likelihood of a good seasonal rally (more in a moment) increases significantly.1Figure 1 – Utilities and resistance (Courtesy ProfitSource by HUBB) (Courtesy AIQ TradingExpert)

One concern may be the fact that a 5-wave Elliott Wave advance appears to possibly have about run its course (according to the algorithmically drawn wave count from ProfitSource by HUBB which I use).  See Figure 2.2Figure 2 – Utilities and Elliott Wave (Courtesy ProfitSource by HUBB)

For what it is worth, the March through July timeframe is “typically” favorable for utilities.  Figure 3 displays the growth of $1,000 invested in the Fidelity Select Sector Utilities fund (ticker FSUTX) ONLY during the months of March through July each year starting in 1982.

3

Figure 3 – Growth of $1,000 invested in ticker FSUTX Mar-Jul every year (1982-2018)

For the record:

*# times UP = 29 (78%)

*# times DOWN = 8 (22%)

*Average UP = +9.3%

*Average DOWN = (-5.8%)

*Largest UP = +21.1% (1989)

*Largest DOWN = (-25.8%) (2002)

*Solid performance but obviously by no means nowhere close to “a sure thing”.

*It should be noted that several of the “Down” years occurred when the S&P 500 was already in a pretty clearly established downtrend (2001, 2002 and 2008), i.e., below its 10-month moving average.  See Figure 4.4Figure 4 – S&P %00 Index w/10-month moving average (Courtesy AIQ TradingExpert)

Summary

Utilities are flirting with new all-time highs and March through July is a “seasonally bullish” period for utilities.  Does that mean “happy days are here again, and we should all be piling into utilities?  Yeah, isn’t that always the thing about the markets?  There is rarely a 100% clear indication for anything.

As always, my “prediction” about what will happen next in utilities is irrelevant and I am NOT pounding the table urging you to pile in.  But I can tell you what I am watching closely at the moment:

*The S&P 500 Index is flirting right around its 10-month moving average (roughly 2,752 on the S&P 500 Index).  If it starts to break down from there then perhaps 2019 may not pan out so well for utilities.

*The Dow Jones Utility Average is facing a serious test of resistance and may run out of steam (according to Elliott Wave).

*But a breakout to the upside could well clear the decks for utilities to be a market leader for the next several months

Focus people, focus.

Jay Kaeppel

Disclaimer:  The data presented herein were obtained from various third-party sources.  While I believe the data to be reliable, no representation is made as to, and no responsibility, warranty or liability is accepted for the accuracy or completeness of such information.  The information, opinions and ideas expressed herein are for informational and educational purposes only and do not constitute and should not be construed as investment advice, an advertisement or offering of investment advisory services, or an offer to sell or a solicitation to buy any security.

Why Oh YYY?

But I repeat myself.  Also, as it turns out, the real question may be “when YYY?”  But of course, to get the full picture the first question to ask and answer is “what YYY?”

Ticker YYY

Ticker YYY is an ETF created in 2011 for the sole purpose of offering a product with a “high yield”, i.e., a high dividend yield.  As stated on the www.YieldShares.com website: “The YieldShares High Income ETF seeks to provide investment results that, before fees and expenses, correspond generally to the price and yield performance of the ISE High Income™ Index. The Index is comprised of 30 closed-end funds (CEFs) ranked highest overall by the ISE in three criteria: fund yield, discount to net asset value and liquidity.”

First the good news: As I write, the yield on ticker YYY is a whopping 8.94%, which instantly gets the attention of yield hungry investors.  The bad news is that – under that age-old category of “there is no free lunch”, that high yield comes at price.  There is a lot of volatility in the price of the shares and as a buy and hold investment it leaves a lot to be desired.  Figure 1 displays the price action since inception.

1Figure 1 – Ticker YYY price performance (Courtesy AIQ TradingExpert)

Average 12 month % return has been +6.4% with a maximum drawdown (using monthly total return data) of -22.4%.  Not so hot.

A Seasonal Strategy for YYY

Ticker YYY has a relatively short history, so what follows is not a recommended strategy as much as it is “food for thought.”  First note that YYY has a much higher correlation  (roughly 62%) to the S&P 500 Index than it does to long-term treasuries (roughly 13%) or 7-10-year treasuries (roughly 13%).

The “strategy” below involves holding YYY ONLY during several months that are typically favorable for the stock market.  Specifically:

*Hold ticker YYY ONLY during the months of January through April AND during the month of July

Figure 2 displays the growth of $1,000 invested ONLY during the five months listed above (blue) versus holding ticker YYY during ALL other months of the year (orange).

2

Figure 2 – Growth of $1,000 invested during Jan-Apr plus July (blue) versus all other months (orange); Jul 2011-Feb 2019

The difference is stark.  The relevant numbers are:

3

Figure 3 – Facts and Figures, Seasonal, Anti-Seasonal and Buy-and-Hold; Jul 2011-Feb 2019

Summary

Does YYY offer a high yield?  It sure does.  Is it a good investment? That is an entirely different question.  In its roughly 7.5-year existence it has had a lot of ups and downs, a great deal of volatility and not a stellar total return when looked at on a buy-and-hold basis.

However, because it has a strong correlation to the stock market it does appear that there might a potential seasonal  component that may be of value.  The bottom line is that the blue equity curve line in Figure 2 is far more appealing than the volatile bar chart in Figure 1.

While this is not something that anyone should “jump into”, it may be something to keep an eye on for investors looking for strong yield without all of the volatility.

Jay Kaeppel

Disclaimer:  The data presented herein were obtained from various third-party sources.  While I believe the data to be reliable, no representation is made as to, and no responsibility, warranty or liability is accepted for the accuracy or completeness of such information.  The information, opinions and ideas expressed herein are for informational and educational purposes only and do not constitute and should not be construed as investment advice, an advertisement or offering of investment advisory services, or an offer to sell or a solicitation to buy any security.

It Really Was the Most Platinum Time of the Year; What Time is it Now?

In this article I highlighted the fact that platinum tends to be a consistent performer during the months of January and February combined.  2019 held serve as platinum futures registered their 23rd Jan-Feb gain in the last 24 years.  The Platinum ETF (ticker PPLT) registered a two month gain of +9.6%.  See Figure 1.

1Figure 1 – Ticker PPLT (Courtesy AIQ TradingExpert)

Figure 2 displays the updated hypothetical growth of equity achieved by holding long 1 platinum futures contract during January and February every year starting in 1979.

2

Figure 2 – Platinum futures $ +(-) during Jan-Feb; 1979-2019

Since most investors will never trade platinum futures, Figure 3 displays the growth of $1,000 invested in ticker PPLT only during Jan and Feb since 2011.

3

Figure 3 – Cumulative % growth of $1,000 invested in ticker PPLT ONLY during Jan. and Feb.; 2011-2019

4

Figure 4 – Yearly % +(-) for PPLT during Jan-Feb

Going Forward

So platinum was great, but what have you done for me lately?  For what it is worth, historically two sectors that “should” be doing well in the March-April period are energies and grains (please remember that seasonal trends DO NOT always work every year).   As you can see in Figure 5, energies have been rallying since late December (though lots of consternation regarding crude oil remains a constant).5Figure 5 – Ticker DBE (Energies) – so far so good; (Courtesy ProfitSource by HUBB)

Grains have been a bust so far (their “favorable seasonal period” typically begins in late January-early February – no dice this time around).  Where too from here?  One of two scenarios: either this is just going to be an off year for grains, or right now will be looked back upon as a buying opportunity.  Only time will tell.

6Figure 6 – Ticker DBA (Agricultural) – so far NOT so good; (Courtesy ProfitSource by HUBB)

And of course, don’t forget that the stock market tends to do pretty well March through May….

Jay Kaeppel

Disclaimer:  The data presented herein were obtained from various third-party sources.  While I believe the data to be reliable, no representation is made as to, and no responsibility, warranty or liability is accepted for the accuracy or completeness of such information.  The information, opinions and ideas expressed herein are for informational and educational purposes only and do not constitute and should not be construed as investment advice, an advertisement or offering of investment advisory services, or an offer to sell or a solicitation to buy any security.