In a recent piece I wrote some thoughts regarding the January Barometer, first advanced by Yale Hirsch of The Stock Trader’s Almanac back in 1972. STA under Yale’s son Jeffrey Hirsch has detailed an updated version of JB titled the January Barometer Trifecta.
On a totally separate topic, many investors eschew any sort of market timing and simply invest by buying-and-holding index funds. One of the most popular indexes is the S&P 500 Index. As you might guess I am not a fan of a strictly buy-and-hold approach as I refer to it as a “drift with the tide” strategy. When things are swell, things are great (the S&P 500 shows a 10-year rolling profit roughly 89% of the time historically), however this requires an investor to ride out every storm along the way. Many investors “think” they are prepared to ride out these storms, but very often about the time the decline hits -30% or more, there is a not uncommon tendency to “abandon ship” at exactly the wrong time.
So, this piece will consider the January Barometer Trifecta (henceforth JBT) as an alternative to buying-and-holding.
The January Barometer Trifecta (JBT)
As detailed by Jeffrey Hirsch the JBT has 3 parts (hence the use of the word “Trifecta”). They are:
*The period including the last 5 trading days of the previous year and the first two trading days of January this year shows a net gain
*The first 5 trading days of January this year shows a net gain
*The month of January as a whole shows a net gain
*When all 3 of these occur then the JBT is “bullish” for the February through December period.
The Data
For testing purposes, we will use:
*S&P 500 monthly total return index data when in the stock market
*Treasury 1-3 monthly total return index data when out of the stock market
*Data is from the PEP database by Callan Associates
*We start our test in January of 1972
Trading Strategy
*If a January Barometer Trifecta is triggered we will buy and hold the S&P 500 Index for 12 months – i.e., from the end of January that year through the end of January next year (to, a) attain a 12-month long-term gains holding period and b) to avoid holding an S&P 500 Index fund only during the month of January
*If a January Barometer is NOT triggered then we will hold 1-3-year treasuries for the next 12 months (i.e., until the end of January next year when we will evaluate JBT again)
The Initial Results
The good news is that the JBT results are much less volatile and entail less risk than buy-and-hold. The bad news is that in terms of total return, it under performs by quite a bit. Figure 1 displays the growth of $1,000 and Figure 2 displays some numerical data.
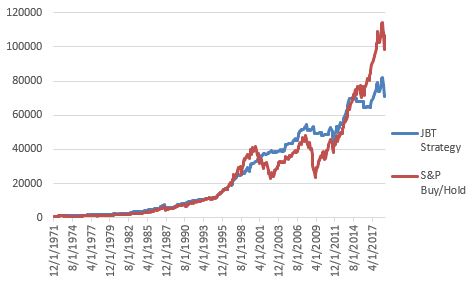
Figure 1 – Growth of $1,000 using JBT Strategy versus SPX buy-and-Hold; 12/31/1972-1/31/2018
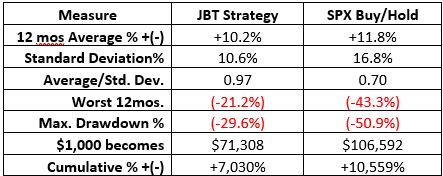
Figure 2 – JBT Strategy versus SPX buy-and-Hold; 12/31/1972-1/31/2018
Reduced volatility is a good thing, but significantly less return is typically a turnoff for most investors. As a result, a person considering a simple buy-and-hold of the S&P 500 Index approach might not be swayed.
But Wait…
Before giving up and settling for “drifting with the tide”, let’s consider one more option. As you can see in Figure 2 the maximum drawdown for the S&P 500 Index was -50.9%. So consider this:
*In order to adopt a buy-and-hold approach you must be OK with sitting through that size of a drawdown.
*If you are willing to sit through that size of a drawdown, then certainly you would be willing to sit through a drawdown of “only” -42.6%, right?
*So for arguments sake, let’s consider the following:
*If a January Barometer Trifecta is triggered we will buy and hold the S&P 500 Index for 12 months using leverage of 1.5-to-1
*If a January Barometer is NOT triggered then we will hold 1-3-year treasuries for the next 12 months (i.e., until the end of January next year when we will evaluate again)
Leveraged Results
Figure 3 displays the growth of $1,000 and Figure 4 displays some numerical data.
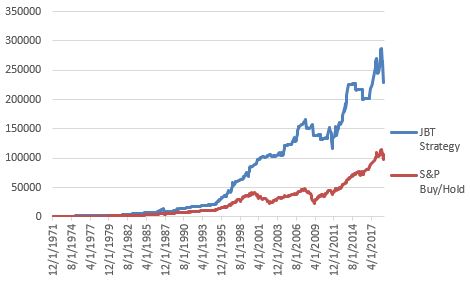
Figure 3 – Growth of $1,000 JBT x 1.5 Leverage Strategy versus SPX buy-and-Hold; 12/31/1972-1/31/2018
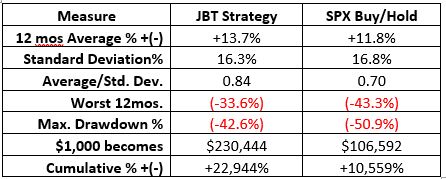
Figure 4 – JBT x 1.5 Leverage Strategy versus SPX buy-and-Hold; 12/31/1972-1/31/2018
Using this approach shows a gain of +22,944% versus +10,559% for buy-and-hold.
The drawdown is a not inconsequential -42.6%, BUT if the alternative is simply buying-and-holding the S&P 500 Index this number is an improvement AND the return is 2.3 times higher than buy-and-hold.
Ways to Trade
As always, I am not “recommending” this strategy, just highlighting numbers. But just to cover all the bases, two ways to play would be:
If JBT is bullish:
*Ticker SSO 75% / ticker SHY 25%
OR
*Ticker UPRO 50% / ticker SHY 50%
If JBT is NOT bullish:
*Ticker SHY 100%
SSO is a 2x leveraged S&P 500 Index ETF. So to get leverage of 1.5-to-1 an investor would put only 75% of their devoted capital into that ETF (2.0 times 75% = 1.5)
UPRO is a 3x leveraged S&P 500 Index ETF. So to get leverage of 1.5-to-1 an investor would put only 50% of their devoted capital into that ETF (3.0 times 50% = 1.5)
Summary
Again, I am not “recommending” this strategy, just highlighting numbers. Still, the question is “does this qualify as a great standalone strategy?” By most standards, possibly not. A 42%+ drawdown is a deal-breaker for most strategic approaches.
But again, in this case the real question is directed at investors who put money into index funds and leave it there. Is it better to trade once in a while and make twice as much with a lower drawdown, or to drift with the tide?
Food for thought…
Jay Kaeppel
Disclaimer: The data presented herein were obtained from various third-party sources. While I believe the data to be reliable, no representation is made as to, and no responsibility, warranty or liability is accepted for the accuracy or completeness of such information. The information, opinions and ideas expressed herein are for informational and educational purposes only and do not constitute and should not be construed as investment advice, an advertisement or offering of investment advisory services, or an offer to sell or a solicitation to buy any security.


Hi Jay,
SSO was available starting from middle of 2006. Which ticker did you use to calculate 1.5X numbers from 1971 to 2006? As always, I love your articles.
Thanks
Mike