Monthly Archives: August 2018

A Simple Guide to Market Mental Health

In this article we are NOT going to talk about trading or investing “specifics”.  We are going to talk about “Peace of Mind.”

When you stop and think about it, it’s almost a little mind-boggling to consider the collective amount of angst and anguish that investors suffer, even – or perhaps I should say “especially” – during a bull market.

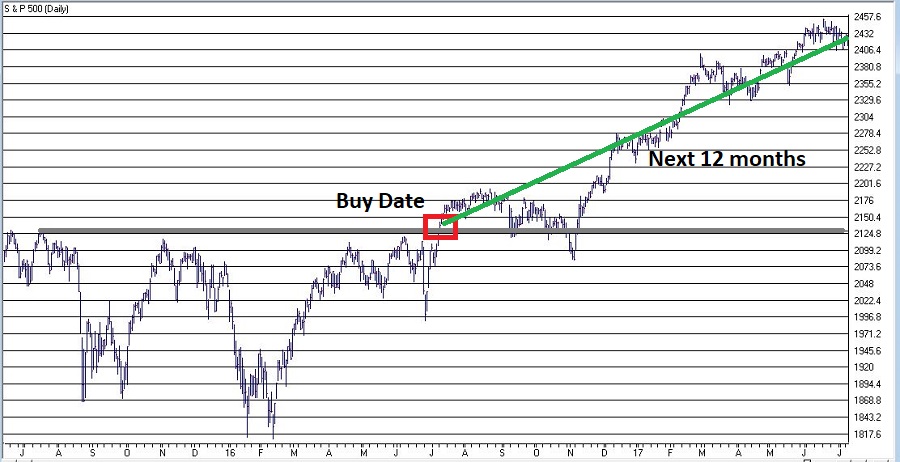
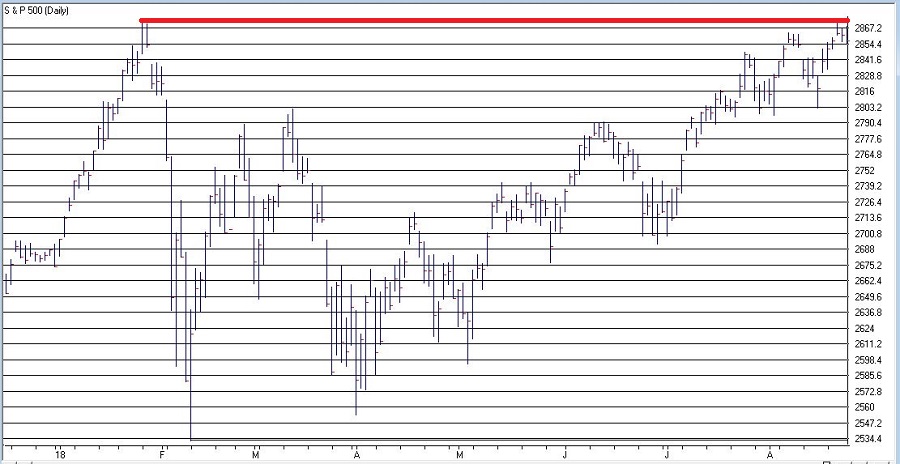
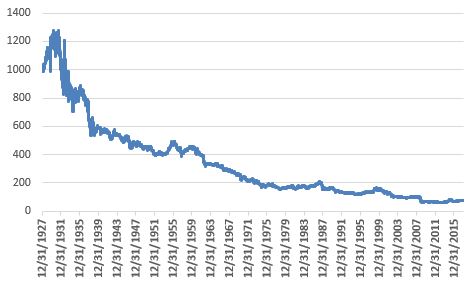
Take a quick glimpse at Figure 1 (click to enlarge)1
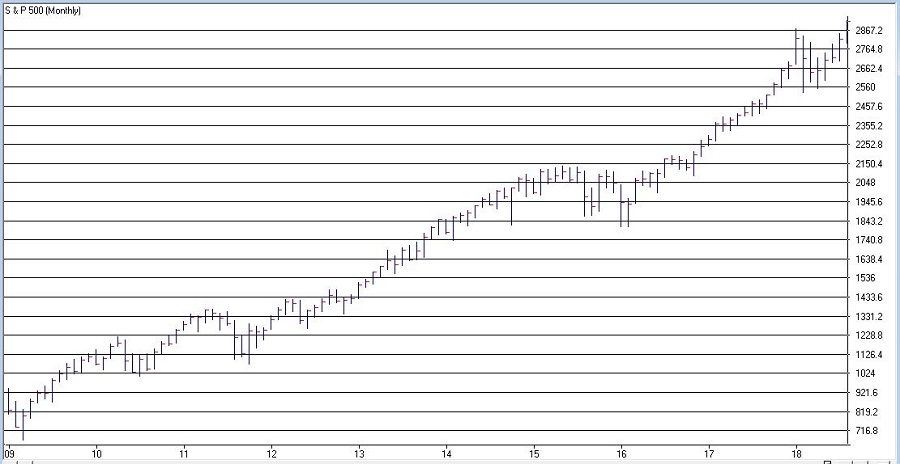
Figure 1 – The S&P 500 Index (Courtesy AIQ TradingExpert)

Then consider how may times between the starting point at the lower left and the ending point at the upper right, you have read an article urging at least “caution” if not downright “concern”.  Or how many times you have heard a pundit discuss in somber tones the “inevitable” negative impact of [rising rates/a narrowing yield curve/overvaluation/China this, China that/(one of 10,000 other possible concerns here)]?

Now the irony is that of course ultimately, these warnings will prove to be right – at least to some extent.  At some point this bull market will end (no, seriously) and history suggests that, yes, in fact the next bear market will not be of the 15-20% orderly correction variety, but rather “one of the painful kind”.  See, even I sound like those guys I just mentioned.

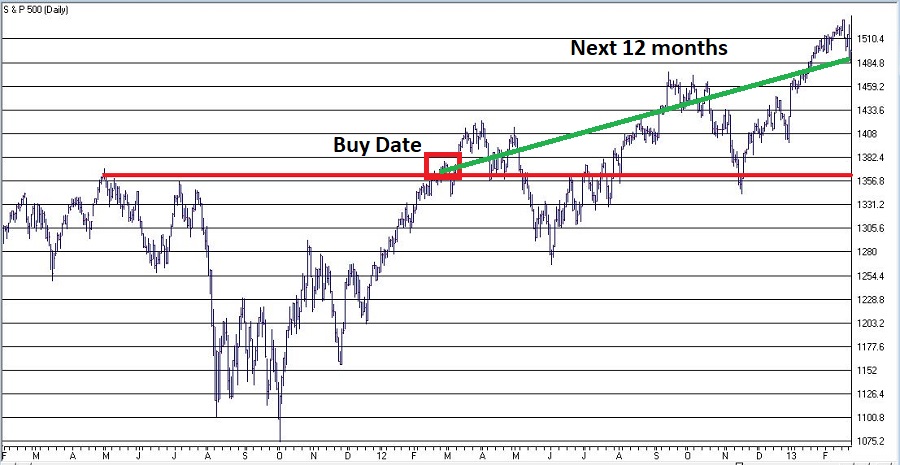
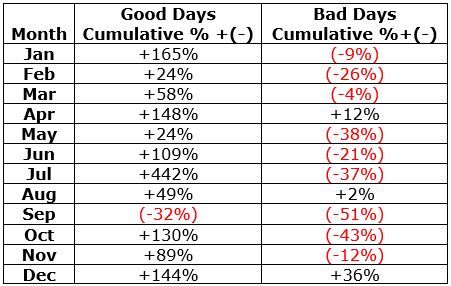
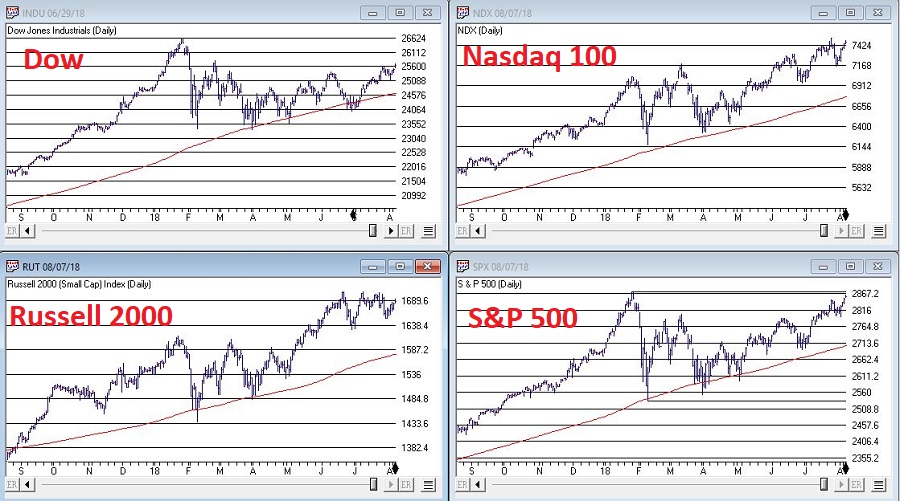
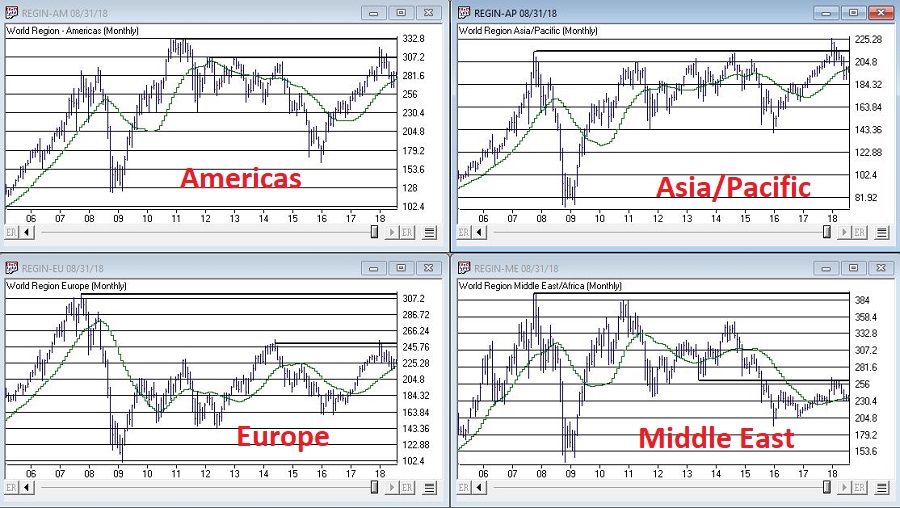
But that’s OK, because caution is always in order when it comes to investing your money.  Angst and anguish and fear on the other hand are wasted emotions.  Figure 2 shows 4 major market averages.  3 have broken out to new highs – only the Dow Industrials have not.  All 4 are well above their 200-day moving averages, i.e., in established uptrends.

(click to enlarge)2
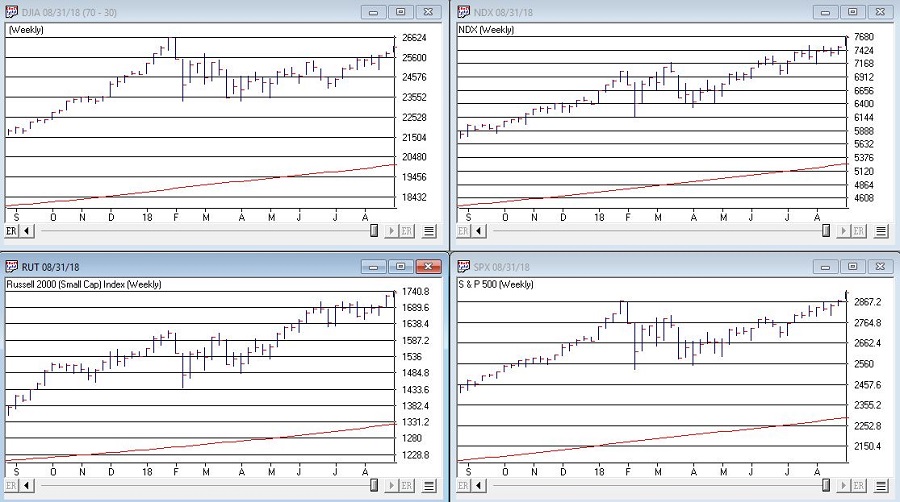
Figure 2 – Four major market averages (Courtesy AIQ TradingExpert)

Trouble in the market may always be just a few days away. But when it comes to dealing with investing in terms of “The Big Picture”, here is my advice:

*When all the major averages are above their 200-day moving averages (not that there is anything magic about 200-days) try to enjoy your life.  Don’t worry, be happy (this does NOT mean “stick your head in the sand and pay no attention to the markets. It means flush the angst and simply focus on following your investment strategy – proper allocation, letting your profits run, cutting your losses, etc., etc.).

*At the same time, remain alert and DO NOT fall in love with a bull market and especially DO NOT “star gaze”, i.e., become enamored with speculating about how much money you are going to make.  In this regard, remember the two following thoughts.

Jay’s Trading Maxim #44: If you are walking down the street and you trip and fall that’s one thing.  If you are climbing a mountain and you trip and fall that is something else.  And if you are gazing at the stars and don’t even realize that you are climbing a mountain and trip and fall – the only applicable phrase is “Look Out Below”.

From Warren Buffet: “Bull markets are like sex.  They feel best at the end.”

*Remember that someday YES, the major averages WILL fall back below their long-term moving averages and some serious defensive action on your part WILL BE necessary if you want to avoid the ravages of riding a multi-year bear market all the way down to the ocean floor.

Now wasn’t that simple?

Summary

As you read and listen to all the “warnings” remember this simple guide to investing contentment.  In sum:

*If the market is going up and the averages are in uptrends – smile, life is good.  Relax and enjoy and ignore/avoid the angst.

*If the market is going down and the average are in downtrends – defend yourself aggressively (or at least your investment capital)!!

In any event, have a nice day…

Jay Kaeppel

Disclaimer:  The data presented herein were obtained from various third-party sources.  While I believe the data to be reliable, no representation is made as to, and no responsibility, warranty or liability is accepted for the accuracy or completeness of such information.  The information, opinions and ideas expressed herein are for informational and educational purposes only and do not constitute and should not be construed as investment advice, an advertisement or offering of investment advisory services, or an offer to sell or a solicitation to buy any security.


The ‘September Strategy’

The “September Strategy” (such as it is) can be summed up pretty simply as follows:

“Enjoy the holiday. Then take the rest of the month off”.

Here are the “rules” (such as they are):

Step 1) Hold the S&P 500 Index January through August and October through December

Step 2) Also hold the SPX for the first three trading days during September.  During all other trading days in September, hold cash (for testing purposes we assume an annualized rate of interest of 1% per year while out of stocks).

To put it another way:

Step 1) Sell the S&P 500 Index at the close of the 3rd trading day of September

Step 2) Buy back the S&P 500 Index at the close of the last trading day of September

OK, so as far as “strategies” go there isn’t much to it granted.  Still, before dismissing it as overly simplistic, let’s take closer look.

Figure 1 displays:

*The growth of $1,000 invested in the S&P 500 index ONLY during the 1st 3 trading days of September from 12/31/1927 through 8/27/2018 (blue line).

*The growth of $1,000 invested in the S&P 500 index ONLY during ALL OTHER trading days of September during the same time (orange line).

1

Figure 1 – Growth of $1,000 invested in the S&P 500 Index ONLY during the 1st 3 trading days of September (blue) versus all other trading days of September (orange); 12/31/1927-8/27/2018

Bottom line:

*1st 3 trading days of September: Sort of OK

*All other September trading days: Not so good

Figure 2 displays the cumulative growth of $1,000 invested using the “System” rules spelled out above versus buy-and-hold since 12/31/1927.2

Figure 2 – Growth of $1,000 using the “September Strategy” (blue) versus buying-and-holding the Dow (orange); 12/31/1927-8/27/2018

For the record, from 12/31/1927 through 8/27/2018:

*$1,000 invested using the “System” grew to $658,930

*$1,000 invested using buy-and-hold grew to $164,028

i.e., over roughly 90 years the “System” has outperformed buy-and-hold by roughly 4-to-1.

So clearly, over the course of the last roughly 90 years stock market performance during September has been, um, “inferior.”

Summary

So, is September like a bad penny – something that should be avoided?  Or does “history” even matter any more, when the stock market basically just opens higher every day and then accelerates higher from there?

It beats me.  I just report the numbers and let you decide.

In any event, hey, enjoy the holiday!

Jay Kaeppel

Disclaimer:  The data presented herein were obtained from various third-party sources.  While I believe the data to be reliable, no representation is made as to, and no responsibility, warranty or liability is accepted for the accuracy or completeness of such information.  The information, opinions and ideas expressed herein are for informational and educational purposes only and do not constitute and should not be construed as investment advice, an advertisement or offering of investment advisory services, or an offer to sell or a solicitation to buy any security.

The SPX ‘Magic Number’

According to one simple technique the “Magic Number” for the S&P 500 Index is 2872.87.  According to this simple technique if the S&P 550 Index closes above this number the stock market “should” continue to be bullish for at least another year.

Sounds optimistic? Well, there certainly are no “sure things” in the financial markets.  Still, let’s take a closer look.

The Simple Technique

The technique I mentioned works like this:

When the S&P 500 Index:

*Closes at its highest price in the past 252 trading days

*For the 1st time in the most recent 126 trading days

*It generates a bullish signal for the next 252 trading days

In essence, we are talking about buying when the index makes a 1-year high for the 1st time in 6 months and holding for 1 year.

Figure 1 displays the most recent previous buy signal that occurred on 7/11/16.  The sell date was 252 trading days later on 7/11/17.1Figure 1 – 2016 Signal (Courtesy AIQ TradingExpert)

Figure 2 displays the signal before that which occurred on 2/27/12.  The sell date was 252 trading days later on 2/26/13.

2Figure 2 – 2012 Signal (Courtesy AIQ TradingExpert)

Figure 3 displays all the signals since 1933.  For the record, there is a one day lag between the actual buy signal and the buy date.

Buy Date Sell Date Buy Price Sell Price %+(-)
5/27/33 4/6/34 9.64 10.95 +13.6
5/18/35 3/20/36 9.87 15.04 +52.4
10/6/38 8/9/39 12.82 11.78 (8.1)
10/7/42 8/10/43 9.17 11.71 +27.7
6/1/44 4/7/45 12.31 13.84 +12.4
5/15/48 4/8/49 16.55 14.97 (9.5)
10/5/49 8/23/50 15.78 18.82 +19.3
3/5/54 3/4/55 26.52 37.52 +41.5
8/4/58 8/4/59 47.94 60.61 +26.4
1/10/61 11/2/62 58.97 57.75 (2.1)
4/15/63 4/15/64 69.09 80.09 +15.9
4/24/67 4/25/68 92.62 96.62 +4.3
4/30/68 6/9/69 97.46 101.2 +3.8
1/8/71 1/6/72 92.19 103.51 +12.3
2/7/72 2/8/73 104.54 113.16 +8.2
6/24/75 6/22/76 94.19 103.47 +9.9
8/1/78 7/31/79 100.66 103.81 +3.1
8/14/79 8/12/80 107.52 123.79 +15.1
10/8/82 10/6/83 131.05 170.28 +29.9
11/7/84 11/7/85 169.17 192.62 +13.9
10/19/88 10/18/89 276.97 341.76 +23.4
5/30/90 2/13/92 360.86 413.69 +14.6
7/30/92 7/29/93 423.92 450.24 +6.2
2/6/95 2/5/96 481.14 641.43 +33.3
9/3/03 9/2/04 1026.27 1118.31 +9.0
11/5/04 11/4/05 1166.17 1220.14 +4.6
10/13/09 10/13/10 1073.19 1178.1 +9.8
11/5/10 11/4/11 1225.85 1253.23 +2.2
2/27/12 2/26/13 1367.59 1496.94 +9.5
7/11/16 7/11/17 2137.16 2425.53 +13.5

Figure 3 – Previous Signals

Things to note:

*27 of the 30 signals (i.e., 90%) have witnessed a 12-month gain

*3 of 30 signals (i.e., 10%) have witnessed a loss

*The last “losing trade” occurred in 1961-1962

*The last 20 signals have been followed by a 12-month gain for the S&P 500

*The average of all 30 signals is +13.9%

*The average for all 27 winning trades is +16.1%

*The average of all 3 losing trades is -6.6%

*The worst losing trade was -9.5%

Two Technical Notes

Believe it or not, into the early 1950’s the stock market used to be open on Saturday.  So those days counted toward the 126 and 252 trading days counts.  This explains why the buy and sell dates prior to 1954 were less than one calendar year apart.

It is possible to get a new signal before an existing signal reaches it’s Sell Date.  In those rare cases we simply extend the holding period an additional 252 trading days.  This occurred in 1961-1962, 1968-1969, 1990-1992.

Figure 4 shows that SPX is very close to generating a new signal.  The most recent high close was in January at 2872.87 which was more than 126 trading days ago.  A new signal will occur if SPX closes above that level.

4Figure 4 – Potential new signal forming (Courtesy AIQ TradingExpert)

Summary

The Good News is that this technique has a 90% accuracy rate and that one good day in the market could generated a new buy signal.  The Bad News is that – as I mentioned earlier – there are no “sure things” in the market.  Given that this particular method is on a 20-trade winning streak, it is understandable to think that maybe the law of averages is against it this time.

We’ll just have to wait and see what happens.

Jay Kaeppel

Disclaimer:  The data presented herein were obtained from various third-party sources.  While I believe the data to be reliable, no representation is made as to, and no responsibility, warranty or liability is accepted for the accuracy or completeness of such information.  The information, opinions and ideas expressed herein are for informational and educational purposes only and do not constitute and should not be construed as investment advice, an advertisement or offering of investment advisory services, or an offer to sell or a solicitation to buy any security.

Winning While Losing (Part 2)

This article is a follow-up to this article which was a follow-up to this original article.

In a nutshell:

*The original article detailed an example trade that was designed to make a lot of money (theoretically) if gold rallied, and to not lose a lot of money if gold fell (the bulk of the risk involved gold remaining unchanged).

*The second article highlighted the fact that the moment the article was written was a terrible time to get bullish on gold (that was the bad news).  The good news is that the trade suffered a miniscule loss even though the timing was essentially 100% wrong (hence the name “Winning While Losing”, i.e., despite what would have been a nightmare scenario if a trader had “bet the ranch” on gold, the result was what was essentially a meaningless loss).

*This article is going to try to turn a sow’s ear into silk by adjusting the initial trade.

The Original Position

The original (albeit hypothetical) position was entered on April 5th as follows:

*Sell 1 GLD Dec31 119 call @ $10.60

*Buy 2 GLD Dec 31 128 calls @ $5.23

The and the original risk curves appear in Figures 1 and 2.

1Figure 1 – Original GLD backspread (Courtesy www.OptionsAnalysis.com)

2Figure 2 – Original GLD backspread risk curves (Courtesy www.OptionsAnalysis.com)

This strategy is referred to as a backspread:

*As you can see in Figure 2 the objective was for gold to go up a lot and for the trade to make a lot of money.

*On the other hand, if gold fell apart the loss would essentially get smaller and smaller the further gold fell.

*The risk occurred if gold remain relatively unchanged.

The current status of this position appears in Figures 3 and 4.

3Figure 3 – Current status of GLD backspread (Courtesy www.OptionsAnalysis.com)

4Figure 4 – Current GLD backspread risk curves (Courtesy www.OptionsAnalysis.com)

Since April 5 GLD has declined from $125.80 to $112.76, a loss of roughly 10%.

The trade as it stands right now has an open loss of just -$37.

The problem now is that GLD must rally a very, very long way for this trade to show any upside gain (and must pass through the “danger zone” where time decay really starts to hurt the position).

So, the choices at this point are:

Choice #1) Do nothing

Choice #2) Exit the trade and call it a day

Choice #3) Adjusting the Position

Choice 1 doesn’t make much sense.  Choice 2 makes a lot of sense (but it isn’t nearly as interesting as Choice #3).

Figure 5 displays the annual seasonal trend for Gold.  As you can see if seasonality is going to exert itself this time around it is sort of a “now or never” (or more accurately, “soon or next year”) proposition.5Figure 5 – Annual Seasonal Trend for Gold (Courtesy Sentimentrader.com)

Likewise, as you can see in Figure 6, trader sentiment towards gold is extremely negative – i.e., a potential contrarian bullish sign.6Figure 6 – Gold bullish sentiment (Courtesy Sentimentrader.com)

So, let’s assume that based on seasonality and sentiment (and perhaps some good old-fashioned stubbornness) we want to take “one more shot” at a bounce in gold.  Once again, instead of “betting the ranch” we will make a simple adjustment to the original trade that will:

*Reduce overall downside dollar risk

*Give us a better chance of making money if gold does actually rally

This adjustment involves:

*Buying 2 GLD Dec31 119 call @ $1.19

*Selling 2 GLD Dec31 128 calls @ $0.34

In a nutshell, we are:

*Closing out our long position in the far-out-of-the-money 128 calls, and;

*Reversing to a long position in the 119 calls

The new position appears in Figure 7 and 8

7Figure 7 – Adjusted GLD trade (Courtesy www.OptionsAnalysis.com)

8Figure 8 – Adjusted GLD risk curves (Courtesy www.OptionsAnalysis.com)

As you can see:

*This trade is still something of a “long shot bet” on a sharp rally in gold

*The maximum $ risk on this position is now just $-154

The bottom line is pretty simple: either gold finally musters some sort of advance between now and the end of the year, or we lose $154.

Summary

The things to keep in mind about options are:

*There is no one best strategy

*Each strategy offers tradeoffs (the backspread can make a lot if you are right and only lose a little if you are dead wrong – but can cost you if nothing at all happens)

*Positions can – and often should – be adjusted to improve the reward-to-risk profile and/or to improve your chances of generating a positive result.

Jay Kaeppel

Disclaimer:  The data presented herein were obtained from various third-party sources.  While I believe the data to be reliable, no representation is made as to, and no responsibility, warranty or liability is accepted for the accuracy or completeness of such information.  The information, opinions and ideas expressed herein are for informational and educational purposes only and do not constitute and should not be construed as investment advice, an advertisement or offering of investment advisory services, or an offer to sell or a solicitation to buy any security.


The ‘Consumer This, Consumer That’ Strategy

When it comes to “consumers consuming”, there are two primary categories:

*Consumer staples: i.e., the stuff we “have” to buy

*Consumer discretionary: The stuff we “want” to buy

The interesting thing is that even though we “always” have to buy the stuff we have to buy and even though we always want to buy the stuff we want to buy, the reality is that there is a time to invest in the companies that make the stuff we have to buy and a separate time to invest in the companies that make the stuff we want to buy (Note to myself: work on those run on sentences).

Two Funds

For our purposes we will use the two following funds to represent our two categories.

*FDFAX Fidelity Select Consumer Staples (“have to buy”)

*FSRPX Fidelity Select Retailing (“want to buy”)

The Test

*We will use monthly total return data from PEP Database from Callan Associates starting in January 1986 through June 2018.

For our purposes we will hold:

*FDFAX from May 1st through October 31st

*FSRPX from November 1st through April 30th

We will look at:

*The results using the “System”

*The results of buying and holding both funds with a rebalance every 6 months (at the end of April and the end of October)

*The results of doing the “opposite” of the System (i.e., hold FSRPX May through October and FDFAX November through April)

The Results

Figure 1 displays the growth of equity for all 3 methods.

1

Figure 1 – Growth of $1,000 for “System”(blue), Buy/Hold/Rebalance (orange) and “Opposite” (grey); 12/31/1985-6/30/2018

For the record:

*$1,000 invested using our “System” grew to $148,951

*$1,000 invested using the “Buy/Hold/Rebalance” method grew to $60,475

*$1,000 invested using the “inverse” approach grew to $19,840

Other Items of Note

Let’s look at “yearly” results.  For our purposes a year ends on October 31st (i.e., after each full 6 months FDFAX/6-month FSRPX investment cycle)

 *# times System UP = 30

*# times System DOWN = 2

*# of times Buy/Hold/Rebalance UP = 28

*# times Buy/Hold /Rebalance DOWN = 4

*# times System outperformed Buy/Hold /Rebalance = 21

*# times System underperformed Buy/Hold /Rebalance =11

Average 12 month % + (-):

*System = + 17.7%

*Buy/Hold /Rebalance = +14.2%

 Summary

 So, is this switching idea a viable standalone investment method?  Sorry folks, I just crunch the numbers.  Before getting too carried away, a quick check with “Realville” reminds us that the “System” experienced a -40% decline from late-2007 through Feb 2009.  So, no “low risk, you can’t lose” opportunity here.

Still, for simplicity’s sake and over consistent performance – as my friend from Jersey would say, “I’ve seen woise.”

Jay Kaeppel

Disclaimer:  The data presented herein were obtained from various third-party sources.  While I believe the data to be reliable, no representation is made as to, and no responsibility, warranty or liability is accepted for the accuracy or completeness of such information.  The information, opinions and ideas expressed herein are for informational and educational purposes only and do not constitute and should not be construed as investment advice, an advertisement or offering of investment advisory services, or an offer to sell or a solicitation to buy any security.

‘Last Gasp’ Crude?

When you boil it all the way down, it can be argued that trading is really a fairly simple two-step process.

Step 1. Spot Opportunity

Step 2. Exploit Opportunity

I learned this fairly simple mantra while I worked with Optionetics back in the 2000’s.  Two of the co-founders – the late George Fontanills and Tom Gentile would engage in a back-and-forth where one would highlight an “opportunity” that they’d “spotted” and then they would take turn detailing some strategy to “exploit” the opportunity.

OK, in practice things can be a bit more complicated.  But if you approach trading with that mindsight it can simplify the process immensely – i.e., everything you do involves either, a) finding a decent setup, or, b) figuring out how to take advantage of that setup.

Like I said, simple.  Right?

Crude Oil

For the record, if there is one thing that I have never really demonstrated any ability to do, it is to predict the next move in the price of crude oil.  So, for the record, what follows is NOT a “recommendation”, but merely an “example” of spotting potential opportunity and trying to find a relatively low risk way to exploit it.

Figure 1 displays spot crude oil – weekly bar chart on the top and daily bar chart on the bottom.  The key thing to note is that the Elliott Wave count (as generated using the objective algorithm built into ProfitSource by HUBB) for both time frames is presently bullish, i.e., pointing to an “up” Wave 5.

(click to enlarge)0Figure 1 – Weekly and Daily Elliott Wave counts “bullish” for crude oil  (Courtesy ProfitSource by HUBB)

The Good News is that my experience has been that when both weekly and daily line up as Wave 5 bullish or bearish there is often a good tradable move.  The Bad News is, “not always”.  In other words, this configuration highlights a potential bullish “opportunity”, however, there is no guarantee and betting on such an outcome should be viewed as a very speculative endeavor.

Figure 2 displays the daily bar chart for ticker USO – an ETF designed to track the price of crude oil.  It too shows a bullish Elliott Wave configuration.

(click to enlarge)

2Figure 2 – Ticker USO

Another key to spotting opportunity is to put as many factors in your favor as possible (all the while remembering that the trade can go south quickly and dramatically regardless).  Figure 3 displays the annual seasonal trend for crude oil from www.sentimentrader.com.  As you can see the next few months form sort of the “last gasp” bullish period for crude before the typical early winter weakness.

(click to enlarge)

3aFigure 3 – Crude Oil Annual Seasonal Trend (Courtesy Sentimentrader.com)

Finally Figure 4 (from www.OptionsAnalysis.com) shows that the implied volatility (the black line on the bar chart) for options on USO is relatively low, i.e., options are “cheap” as there is no a lot of time premium built into the price of the options.

(click to enlarge)4aFigure 4 – Ticker USO; implied volatility (IV) is relatively low; i.e., options are “cheap”  (Courtesy www.OptionsAnalysis.com)

So, let’s assume a trader finds this a compelling bullish opportunity (and again, I am not claiming that it is).  How to exploit said opportunity?  There are many ways, with buying shares of USO being the most straightforward.  Another simple approach would be to buy a call option on USO.  With IV low this makes sense.  The example I will use involves:

*Buying USO Jan2019 14 call @ $1.04

Buying one call costs $104 and gives you a “delta” of 56.85.  This simply means that this position will act much like a position of buying 57 shares of USO (however, it would cost you $803 – $14.08 a shares x 57 shares) to enter that position.  So, in this example our total cost – and total maximum risk is $104.

(click to enlarge)4Figure 5 – USO January call (Courtesy www.OptionsAnalysis.com)

(click to enlarge)

5a

Figure 6 – USO January call risk curves (Courtesy www.OptionsAnalysis.com)

As you can see in Figure 6 the outcomes are pretty straightforward:

*If USO goes up a lot this trade can make good money

*If USO remains unchanged or declines this trade will lose money, period

Summary

So as far as evaluating this “example” opportunity it comes down to this:

1. Do you put any faith in the bullish Elliott Wave counts for crude oil and USO?

2. Do you put any faith in crude exhibiting seasonal strength in the weeks ahead?

3. Do you have $104 bucks?

Jay Kaeppel

Disclaimer:  The data presented herein were obtained from various third-party sources.  While I believe the data to be reliable, no representation is made as to, and no responsibility, warranty or liability is accepted for the accuracy or completeness of such information.  The information, opinions and ideas expressed herein are for informational and educational purposes only and do not constitute and should not be construed as investment advice, an advertisement or offering of investment advisory services, or an offer to sell or a solicitation to buy any security.


Don’t Have a ‘Bad Day’

Every once in awhile I stumble across a study regarding what would happen to your long-term returns if you missed the “best” days in the stock market.  This article is usually written to argue for buying and holding in the stock market and to highlight the apparent folly of trying to “time” the market.  In other words, if you miss just a handful of the biggest daily gains the argument goes, your long-term returns suffer greatly.

Mathematically it seems to make sense.  Likewise, as a guy who long ago thought he had a “crystal ball” for timing stock market buys and sells (I stared in to that da%& thing for a long time before I finally realized that it didn’t actually work…but I digress), I am well versed in the pitfalls of trying to “pick tops and bottoms with uncanny accuracy” (even though, truth be told I still love the way that phrase sounds…again, I digress).

Still, the funny thing is, despite the purported folly of NOT buying-and-holding – the one thing I hate more than missing the occasional “best day” is riding the occasional 20%, 30% or 40% or more bear market all the way to the bottom.  So – truth be told – I’ll probably continue to take my chances.

But, here’s a different thought: Would it be a good thing to miss some of the “Bad Days?  And is there a relatively simple way to do so?  Turns out the answers are “Yes” and “Yes”.

Trading Days of the Month

So here is how we roll:  the last trading day of the month is referred to as TDM (trading day of month) #-1.  The day before that is TDM -2, the one before that is -3 and so on and so forth.

So, for our test:

We are going to use S&P 500 Index daily price data from 12/31/1927 through 12/31/2017 (i.e., 90 years of daily price data)

We divide each month into two parts:

“Bad Days” = TDM #-10 through TDM #-5 (i.e., 6 contiguous trading days)

“Good Days” = All other trading days of the month.

Figure 1 displays the growth of $1,000 invested in the S&P 500 Index ONLY during all the “Bad Days.”

1a

Figure 1 – Growth of $1,000 invested in the S&P 500 Index ONLY during the “Bad Days” (TDM -10 through TDM -5) every month; 12/31/1927-12/31/2017

As you can see in Figure 1, the “Bad Days” have in fact been pretty “bad”.  Here are the net results – Cumulative % returns from 12/31/1927-12/31/2017:

*All Days (i.e., buy and hold = +15,039%

*Bad Days (i.e., TDM -10 through TDM -5) = (-92%)

*Good Days (i.e., all other trading days of month) = +195,671%

Figure 2 displays the results of “Good Days” and “Bad Days” by month over the full test period.

2a

Figure 2 – “Good Days” % return versus “Bad Days” % return by month; 12/31/1927-12/31/2017

As you can see in Figure 2:

*The “Good Days” made money in every month except September

*The “Bad Days” lost money in every month except April, August and especially December

Summary

Does it really make sense to “sell everything” for 6 trading days every month?  That’s not for me to say.  Still, the fact that the “Bad Days” lost a cumulative -92% over the past 90 years suggests there might be a “there”, um, “there.”

Jay Kaeppel

Disclaimer:  The data presented herein were obtained from various third-party sources.  While I believe the data to be reliable, no representation is made as to, and no responsibility, warranty or liability is accepted for the accuracy or completeness of such information.  The information, opinions and ideas expressed herein are for informational and educational purposes only and do not constitute and should not be construed as investment advice, an advertisement or offering of investment advisory services, or an offer to sell or a solicitation to buy any security.


When It All Becomes Too Obvious

Investors who pay close attention to the financial markets by and large spend a fair amount of time being “perplexed.”  If you take all the “news” related to the markets and combine that with all the day-to-day and week-to-week gyrations of the markets, there often seems to be no rhyme or reason for what goes on (hence the reason I generally advocate a slightly less hyper, more trend-driven approach).

But sometimes it all seems to come crystal clear.  In the most recent fortnight most of the major market averages (with the Dow and S&P 500 being the primary exceptions) have touched or at least teased new highs.  Facebook got crushed and the market didn’t tank.  Tesla struggled mightily before bursting back into the bright sunlight – and the market didn’t tank.  In fact, all kinds of things have happened and still the major U.S. averages march relentlessly higher backed by a strong economy, reasonably moderate inflation and higher, yet by no means high interest rates.

At this point, it appears “obvious” that there is no end in sight to the Great Bull Market.  A number of momentum studies I have read lately seem to all confirm that the U.S. market will continue to march higher to significantly higher new highs.

And the fact that it is so “obvious” scares the $%^& out of me.  Don’t misunderstand.  This is not about to devolve into a hysterical “Sell Everything!” screed.  The trend is bullish therefore so am I.  But the “what could possibly go wrong” antennae still pop up from time to time.  So here are some random views regarding all things stock market.

The Major Averages

Figure 1 displays 4 major U.S. market averages.  All are in uptrends above their respective 200-day moving averages and all are close to all-time highs.  The big question is “what happens when they get there?”  Do they all break through effortlessly?  Or do we get a “struggle?”

(click to enlarge)1Figure 1 – The Major U.S. Averages; clearly in up trends, but… (Courtesy AIQ TradingExpert)

Figure 2 displays my own 4 market “bellwethers”, including the semiconductors (SMH), Dow Transports (TRAN), Inverse VIX ETF (ZIV) and Sotheby’s Holdings (BID).  At the moment, none of these are actively “confirming” new highs and they each have a clear “line in the sand” resistance level overhead.  So, for the moment they presently pose something of a minor warning sign.

(click to enlarge)2Figure 2 – Jay’s Market “Bellwethers”; stuck in “nowhere” (Courtesy AIQ TradingExpert)

While the U.S. economy and stock market appear to be hitting on all cylinders, the rest of the world is sort of “chugging along.”  Figure 3 displays 4 “Geographic Groups” that I follow – The Americas, Asia/Pacific, Europe and Middle East.  The good news is that each group is presently holding above it’s respective 21-month moving average.  So technically, the trend is “Up.”  But the bad news is that each group has some significant overhead resistance, so the current uptrend is by no means of the “rip roaring” variety.

(click to enlarge)3Figure 3 – Major Geographic Groups; Hanging onto uptrends but serious overhead resistance (Courtesy AIQ TradingExpert)

The VIX Index

Traders have been pretty much conditioned in recent years to assume that the VIX Index – which measures volatility and by extension, “fear” – is and will remain low as the market chugs higher.  And that may prove to be true.  But when everything gets to “obvious” (i.e., the U.S. market is “clearly” heading higher) and things get too quiet (VIX dropped below 11% for the 1st time in 3 months) it can pay to “expect the unexpected.”

Figure 4 is from www.sentimentrader.com and displays those instances in the past when the VIX Index fell below 11% for the first time in 3 months.  Historically, VIX makes some kind of an up move in the 2 to 3 months following such occurrences.

(click to enlarge)

4Figure 4 – VIX Index performance after VIX Index drops below 11% for 1st time in 3 months (Courtesy Sentimentrader.com)

Things may or may not play out “like usual” this time around, however, given that…

*The U.S. averages are “obviously” heading higher

*The market bellwethers are so far not confirming

*The rest of the worlds stock markets are nowhere near as strong

*VIX has a history of “spiking”, especially during the seasonally unfavorable months of August and September

…It might make sense to consider a long volatility play (NOTE: Long volatility plays using ticker VXX have a long history of not panning out as ticker VXX is essentially built to go to zero – for more information on VXX and the effects of “contango” please see www.Google.com.  Long VXX trades are best considered).

One example appears in Figures 5 and 6.  This trade involves:

*Buying 5 Oct VXX 31 calls @ $2.74

*Selling 4 Oct VXX 36 calls @ $1.82

(click to enlarge)5Figure 5 – VXX example trade particulars (Courtesy www.OptionsAnalysis.com)

(click to enlarge)6Figure 6 – VXX example trade risk curves (Courtesy www.OptionsAnalysis.com)

The maximum risk is $642 if VXX fails to get above the breakeven price of $32.28 by October 19th.  On the other hand, if something completely not “obvious” happens and volatility does in fact spike, the trade has significant upside potential.

(NOTE: As always, please remember that this is an “example” of a speculative contrarian trade, and NOT a “recommendation.”  If the stock market rallies – as it “obviously” seems to want to do, this trade will likely lose money.)

Jay Kaeppel

Disclaimer:  The data presented herein were obtained from various third-party sources.  While I believe the data to be reliable, no representation is made as to, and no responsibility, warranty or liability is accepted for the accuracy or completeness of such information.  The information, opinions and ideas expressed herein are for informational and educational purposes only and do not constitute and should not be construed as investment advice, an advertisement or offering of investment advisory services, or an offer to sell or a solicitation to buy any security.