A lot of trades get made based on earnings. Some investors buy (or sell short) shares in anticipation of strongly higher (or lower) earnings announcements. Some option traders try to play both sides by buying a straddle (i.e., buy a call and a put option in hopes that the underlying shares will move significantly in one direction or the other) and hope that the gain on the profitable side will be larger than the loss on the other side.
Today I will highlight “third way.” It definitely qualifies as something of a “special situation” and an option strategy that in all candor is typically best avoided.
The Reverse Calendar Spread
A standard calendar spread involves buying a call or put option at a given strike price in a farther out expiration month and selling a call or put option at the same strike price in a closer expiration month. The hope is that the underlying security will remain within a particular price range and a profit will ensue as the shorter term option loses time premium faster than the longer-term option. An example of a standard calendar spread appears in Figure 1.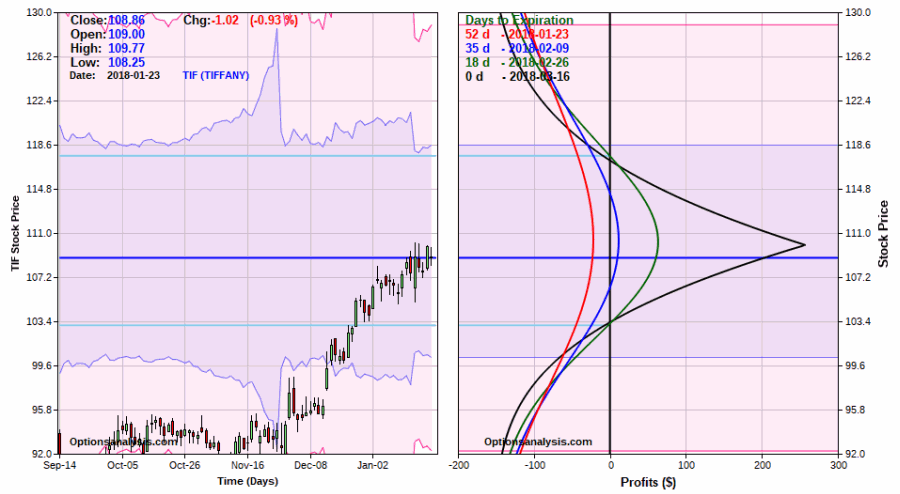 Figure 1 – Standard calendar spread risk curves(Courtesy www.OptionsAnalysis.com)
As you might guess, the Reverse Calendar Spread is entered by doing the opposite – buying the shorter term option and selling the longer term. Why would someone do this? Is this even a good idea? The candid answer is “it depends”. In reality, this strategy should only be used under certain circumstances.
Like what? I thought you’d never ask.
To profit using this strategy two catalysts need to be in place:
1. A reason to believe the underlying security will make a move
2. Extremely high implied volatility and some expectation that volatility will decline during the course of the trade
Enter Under Armor
First off – as always – what follows is NOT a “recommendation”, but merely an “example”.
Before proceeding, a quick lesson in implied volatility. In Figure 2 we see a bar chart for ticker UA along with the implied volatility for 90+ day UA options. You don’t have to be an expert to recognize that implied volatility is at an extremely high level.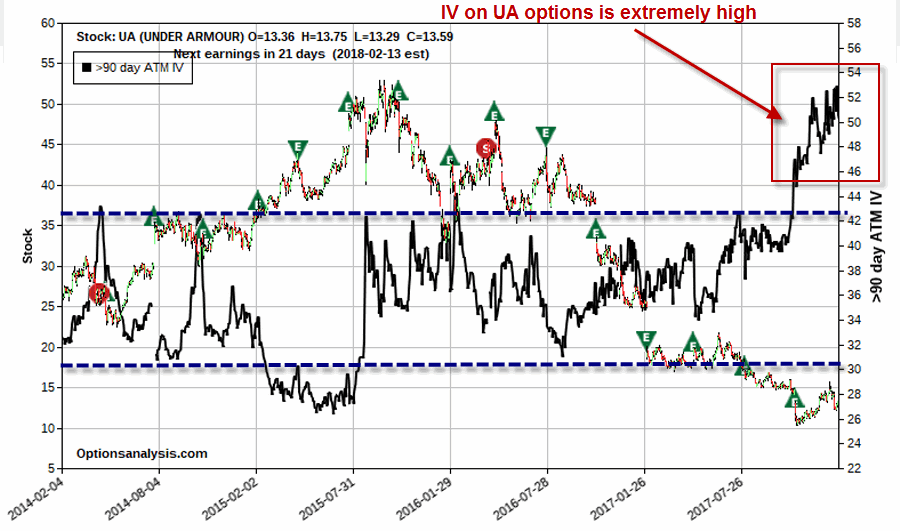 Figure 2 – Ticker UA with implied option volatility at record highs (Courtesy www.OptionsAnalysis.com)
Why does this matter? Two things to keep in mind.
1. IV tells us relatively how much time premium is built into the price of the options on a given security. So Figure 1 tells us that UA options are “expensive”.
2. Longer-term options will gain or lose much more time premium than shorter-term options based on changes in IV.
OK, now to our example trade:
*Buy 1 UA Apr2018 12.5 put
*Sell 1 UA Jan2019 12.5 put
Figure 3 displays the particulars of the trade. Note the “Vega” figure of -$2.51 in the upper right. A quick explanation. Vega is a Greek term that tells us how much (in dollars) this position will gain or lose if implied volatility rises by one percentage point. So in this case we see that IV rises even higher from here that will hurt this trade since Vega is negative. However, this trade is a bet on sharply lower IV going forward. In other words the impetus for the trade is the hope that after earnings are announced the implied volatile for UA options will collapse back down into the normal range.
In this case, if IV fell 10 full percentage points it would generate $25.10 in profit in this trade (-$2.51 x -10 points = +$25.10). Are we having fun yet?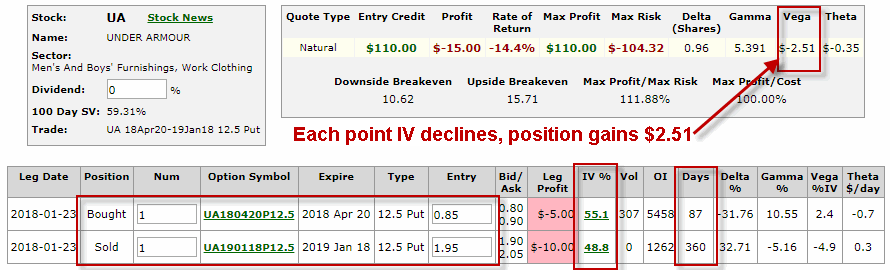 Figure 3 – UA Reverse Calendar Spread particulars (Courtesy www.OptionsAnalysis.com)
Figure 4 displays the risk curves for the trade at the time the trade is entered. Note that these curves are not terribly impressive on the face of it, as it would appear that a significant price move is required to generate a profit. Of course, the other catalyst for the trade is the belief that the stock price may jump or fall significantly when earnings are announced.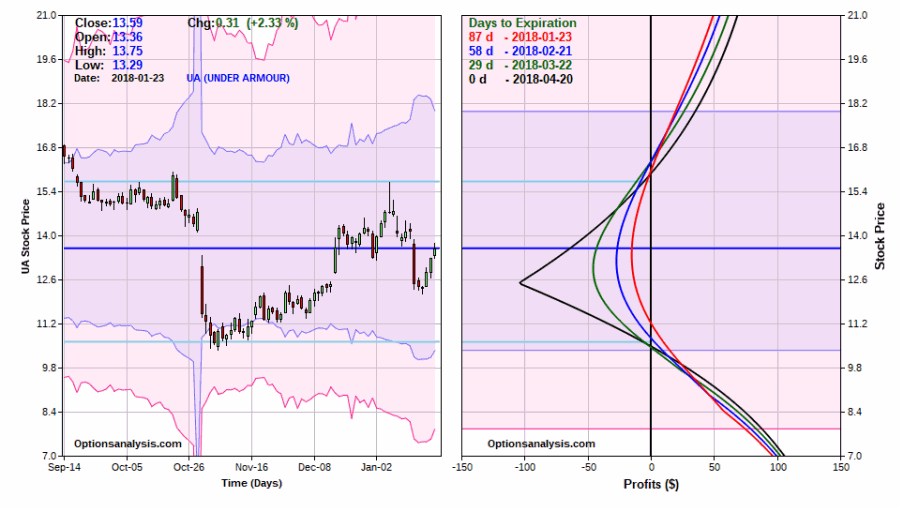 Figure 4 – UA Reverse Calendar Spread initial risk curves (Courtesy www.OptionsAnalysis.com)
Now let’s look at what might happen if in fact we are correct and that
1. Implied volatility collapse after earnings are announced, and/or;
2. Price makes a significant jump or fall
We are hoping for a “quick” profit – i.e., earnings are announced and a) and/or b) above occur, we take our profit and move on. However, if that does not happen, because the option we are buying expire in April we could hang on for awhile if necessary to see if IV will eventually subside.
Still, because time decay works against this trade in the last 30 days we will assume that we will not hold this position during the last 30 days before July expiration.
To test these possibilities, in Optionsanalysis.com we will adjust the settings for this position as shown in Figure 5 – i.e., we will assume as 30% decline in IV (done by setting the multiplier to 0.70) and we will set the last date for the risk curve to 30 days before July expiration.
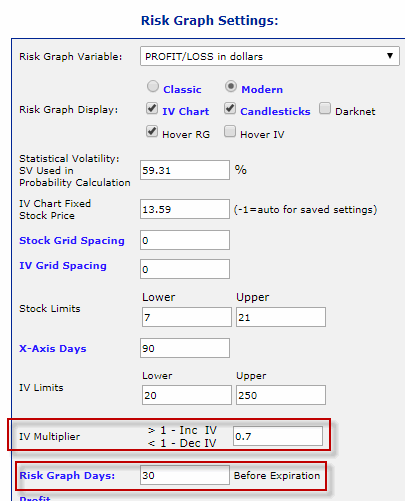
Figure 5 – Adjusting IV levels in OptionsAnalysis (Courtesy www.OptionsAnalysis.com)
If in fact IV declines by 30%, our risk curves for this position will resemble those displayed in Figure 6.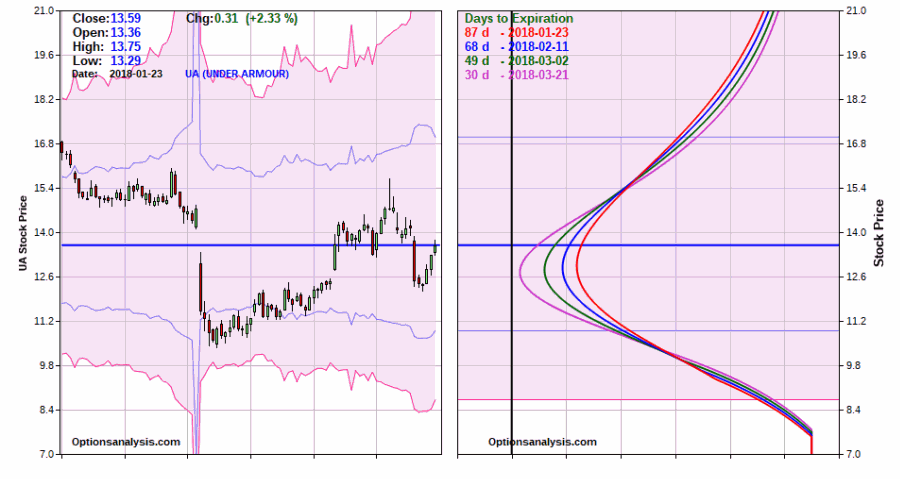 Figure 6 – UA Reverse Calendar Spread risk curves if IV falls 30% from current record high levels (Courtesy www.OptionsAnalysis.com)
What we see is the decline in volatility causes the January2019 call option that we are short to give up a lot of its time premium. As you can see, under this scenario this trade would be profitable at any price. Also, the further the price of UA moves the more profitable the trade.
Summary
As always, I need to emphasize again that I am not “recommending” this trade. I am simply using it to illustrate “one way” to trade based on a given set of circumstances. To recap:
*A company will soon be announcing earnings
*Speculation about those earnings has driven implied option volatility to exorbitant levels
*We are willing to risk a certain amount of money that when earnings are announced the price of the stock will move significantly, and/or implied volatility to decline significantly.
Ironically, under most circumstance the Reverse Calendar Spread is not an attractive choice of strategy. But as you have seen, under the right circumstances – and assuming of course that any of our assumptions actually play out – it can offer some interesting potential.
Jay Kaeppel
Disclaimer: The data presented herein were obtained from various third-party sources. While I believe the data to be reliable, no representation is made as to, and no responsibility, warranty or liability is accepted for the accuracy or completeness of such information. The information, opinions and ideas expressed herein are for informational and educational purposes only and do not constitute and should not be construed as investment advice, an advertisement or offering of investment advisory services, or an offer to sell or a solicitation to buy any security.

