Monthly Archives: November 2017

A Bottom-Picking Portfolio

In a recent article I highlighted some stocks that appeared to have a chance of “putting in a low”.  In another article, I highlighted the potential usefulness of “horizontal lines” on a chart.  The phrase “putting in a low” is essentially a kindler, gentler version of the phrase “Hey, let’s pick a bottom”.

The reality is that the ability to “pick tops and/or bottoms” on any kind of a consistent basis is a skill that roughly 99.2% of all investors and traders do not possess.  That being said, there is such a thing as a legitimate “bottom formation” (at least in my market addled opinion).  A security that bounces several or more times off a particular price is sending information that the sellers may be running out of ammunition.  These levels can be observed by drawing horizontal trend lines across a price chart – connecting recent highs and/or lows at roughly similar prices.

“Loading up” in this situation is not recommended. But committing an acceptable percentage of one’s portfolio (a level which each investor must decide on their own) to such opportunities is a perfectly acceptable form of speculation.

So for arguments sake, below is a “Bottom Pickers Portfolio”.  As always, I am not recommending this as an investment, simply highlighting an alternative idea for your further consideration.

The Tickers

The tickers included in this portfolio are mostly all commodity related.  That is not a purposeful choice; they simply “fit the model”.

First is ticker BAL – an ETF that tracks the price of cotton futures.  The critical level for BAL is roughly the $43.50 area.1Figure 1 – Ticker BAL (Courtesy AIQ TradingExpert)

Ticker GDX tracks a gold stock index and has been consolidating in a relatively tight range after last year’s sharp rally and subsequent pullback.2Figure 2 – Ticker GDX (Courtesy AIQ TradingExpert)

Ticker JO tracks the price of coffee futures.  This is one of the weakest charts on the list and is dangerously close to failing to the downside.  However, if the low holds this will strengthen the outlook a great deal.3Figure 3 – Ticker JO (Courtesy AIQ TradingExpert)

Ticker SGG tracks the price of sugar futures. SGG has been consolidating in a narrow range for about four months.  Key price levels on the downside are $26.50 and the August 2015 low of $24.79.4Figure 4 – Ticker SGG (Courtesy AIQ TradingExpert)

Ticker SWN is Southwestern Energy Co.  After a long, devastating decline the stock is attempting to form a low in the $5 a share range.5Figure 5 – Ticker SWN (Courtesy AIQ TradingExpert)

Ticker UNG tracks natural gas futures.  Thanks to the advent of fracking – which is made natural gas abundantly available – the price of natural gas has collapsed in recent years.  In the past week it retested its 2016 low and then ticked higher.  Like JO, this one is precariously close to “failing”.  But for now…

6Figure 6 – Ticker UNG (Courtesy AIQ TradingExpert)

The Bottom Pickers Portfolio                      

I use AIQ TradingExpert software to create my own “Groups”.  So I created one called “Lows” to include the six tickers above.  The group consists of an equal dollar investment in each ticker.  The chart for this combination of tickers appears in Figure 7.

7Figure 7 – The “Lows” Group (Courtesy AIQ TradingExpert)

Summary

Let me be blunt.  There is every chance that the majority of the tickers highlighted above will continue their long-term bearish trends and break down to the downside causing further losses for those holding these shares.

The primary thing to highlight in this piece is a personal preference.  I prefer “horizontal” lines on a chart – i.e., straight across, left to right – to the more typical slanted trend lines that most traders use.  The reason is simply – upward or downward slanting trend lines require a trader to decide which two (or more) highs (or lows) to connect in order to draw the trend line.  At the end of the day this is often a subjective decision.

Horizontal trend lines – which connect to (at least roughly equal) highs or lows – are generated by the market itself and as such, are more objective in nature.  In other words, investor buying and selling determines these levels.

Will my “Bottom Pickers Portfolio” move to the upside or fail to the downside?  We’ll just have to wait to find out.

Jay Kaeppel

Disclaimer:  The data presented herein were obtained from various third-party sources.  While I believe the data to be reliable, no representation is made as to, and no responsibility, warranty or liability is accepted for the accuracy or completeness of such information.  The information, opinions and ideas expressed herein are for informational and educational purposes only and do not constitute and should not be construed as investment advice, an advertisement or offering of investment advisory services, or an offer to sell or a solicitation to buy any security.
Some Days Really are Worse than Others; Part III

In two articles (here and here) I tried to point out that there might be a way to know in advance if you are about to have a “bad day” – at least in the stock market.  Here I want to summarize everything in chart and one table.

First a recap.

The Bad Days

For our purposes we will count the first trading day of the month as TDM 1, the second as TDM 2 and so on.

We will also count backwards from the last trading day of the month as follows: The last trading day of the month is TDM -1, the next to last day is TDM -2 and so on.

Here are the “Bad Days” of the month:

*TDM 13 through TDM 16

*TDM -10 through TDM -5

For this piece I used daily price data for the Dow Jones Industrials Average starting on 12/31/1933 and for each calendar month I calculated the cumulative price gain or loss for the Dow:

a) On the “Bad Days” listed above

b) All other trading days of the month

The Results

In a nutshell, for every single month except August and December:

*The “Bad Days” lost money

*”All other days” made money

*For the month of August both periods lost money.

*For the month of December both periods made money.

Figure 1 summarizes everything starting on January 1st 1934

*The Column labeled “Bad Days” displays the cumulative price gain or loss or the Dow Jones Industrials Average by month ONLY during the “Bad Days” listed above.

*The Column labeled “All Other Days” displays the cumulative price gain or loss or the Dow Jones Industrials Average by month ONLY during all trading days of the month that DO NOT fit into the “Bad Days” listed above.

Month All Other Days

Cumulative % +(-)

Bad Days

Cumulative % +(-)

Jan +136.0% (-23.8%)
Feb +25.1% (-12.8%)
Mar +60.7% (-3.7%)
Apr +235.1% (-1.1%)
May +50.7% (-38.8%)
Jun +68.3% (-27.5%)
Jul +250.0% (-14.3%)
Aug (-6.1%) (-17.0%)
Sep +5.5% (-41.7%)
Oct +170.3% (-36.8%)
Nov +147.7% (-12.8%)
Dec +158.3% +50.7%

Figure 1 – Cumulative Monthly % +(-) for Dow on “Bad Days” versus all other days; 12/31/1933-10/31/2017

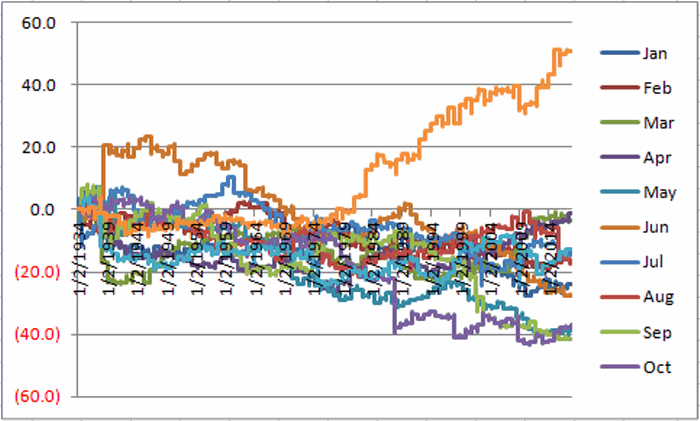
Figure 2 displays graphically the gain/loss per month during the “Bad Days”.  Note that December is the ONLY month to show a cumulative gain during these days.BaddaysFigure 2 – Dow %+/- by month ONLY during “Bad Days”

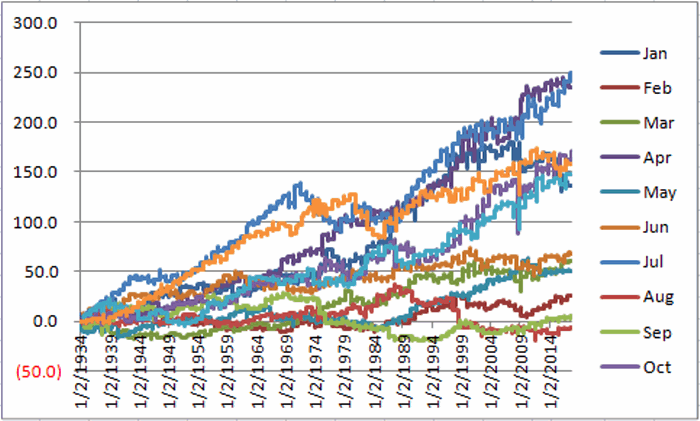
Figure 3 displays graphically the gain/loss per month during “All Other Days”.  Note that August is the ONLY month to show a cumulative loss during these days.nonbaddaysFigure 3 – Dow %+/- by month ONLY during “Bad Days”

Summary

So is it worthwhile to trade out of the market on the “Bad Days” and to be back in the market on “All Other Days”?  That’s not for me to say.  But 83+ years of market history makes a compelling case.

Have a Good Day (or not, you know, depending…)

Jay Kaeppel

Disclaimer:  The data presented herein were obtained from various third-party sources.  While I believe the data to be reliable, no representation is made as to, and no responsibility, warranty or liability is accepted for the accuracy or completeness of such information.  The information, opinions and ideas expressed herein are for informational and educational purposes only and do not constitute and should not be construed as investment advice, an advertisement or offering of investment advisory services, or an offer to sell or a solicitation to buy any security.

Some Days Really are Worse than Others; Part II

In response to some questions on the “Avoid Bad Days System” –we’ll call it the ABD System for short (Note to myself: come up with a better name) I wrote about here, this article includes some more details, fact, figures, etc.

*In a nutshell, the ABD System outperforms by being out of the market during a lot of bad days.  It also does it by outperforming the overall market when the overall market has a bad year.  To wit:

*During the 21 calendar years since 1946 when the Dow has showed a loss for the year, the ABD System outperformed the Dow 20 times and underperformed only once.

Concistency is another key:

*ABD System showed a gain during all 68 rolling 5-year periods and outperformed the Dow during 48 of 68 rolling 5-year periods.

*ABD System showed a gain during all 63 rolling 10-year periods and outperformed the Dow during 54 of 63 rolling 5-year periods.

1-Year Returns

  System Buy/Hold BadDays System-Buy/Hold
Average 10.4% 7.9% (2.1%) +2.5%
Median 10.2% 9.7% (1.6%) +2.1%
Std Dev 11.9% 15.5% 8.5% 9.0%
Ave/Std Dev 0.87 0.51 (0.24) 0.27
Max% 36.4% 44.0% 15.3% 20.1%
Min% (16.4%) (33.8%) (23.0%) (16.2%)
# Up 59 51 33 40
# Down 13 21 39 32

Figure 1

5-Year Rolling Returns

System Buy/Hold BadDays System-Buy/Hold
Average 64.7% 46.7% (10.2%) +18.0%
Median 60.0% 47.8% (13.3%) +21.3%
Std Dev 36.2% 45.9% 16.4% 26.6%
Ave/Std Dev 1.79 1.02 (0.62) 0.68
Max % 149.7% 199.8% 37.4% 72.0%
Min % 2.6% (23.0%) (31.6%) (56.6%)
# Up 68 55 22 48
# Down 0 13 46 20

Figure 2 – Using 5-Year Look back at the end of each year

10-Year Rolling Returns

System Buy/Hold BadDays System-Buy/Hold
Average 176.4% 114.5% (21.1%) +61.9%
Median 156.3% 96.6% (21.6%) +67.3%
Std Dev 98.9% 95.6% 18.9% 46.5%
Ave/StdDev 1.78 1.20 (1.12) 1.33
Max % 408.2% 323.4% 19.2% 141.9%
Min % 26.1% (29.5%) (51.2%) (44.6%)
# Up 63 56 9 54
# Down 0 7 54 9

Figure 3 – Using 10-Year Look back at the end of each year

Year-by-Year Results 

Year System Buy/Hold BadDays System-

Buy/Hold

1946 10.1 (8.1) (16.2) 18.2
1947 (3.7) 2.2 6.6 (6.0)
1948 (3.0) (2.1) 1.3 (0.9)
1949 11.2 12.9 1.9 (1.7)
1950 7.9 17.6 9.4 (9.7)
1951 30.4 14.4 (12.0) 16.1
1952 4.5 8.4 4.1 (3.9)
1953 (1.2) (3.8) (2.3) 2.5
1954 33.4 44.0 8.2 (10.5)
1955 11.8 20.8 8.3 (8.9)
1956 13.9 2.3 (9.9) 11.6
1957 (5.1) (12.8) (7.8) 7.7
1958 32.9 34.0 1.1 (1.1)
1959 8.6 16.4 7.5 (7.8)
1960 7.0 (9.3) (15.0) 16.3
1961 23.2 18.7 (3.3) 4.4
1962 6.9 (10.8) (16.3) 17.7
1963 17.8 17.0 (0.4) 0.8
1964 12.7 14.6 1.9 (1.8)
1965 16.7 10.9 (4.7) 5.8
1966 (9.1) (18.9) (10.5) 9.8
1967 15.2 15.2 0.3 0.0
1968 15.1 4.3 (9.1) 10.8
1969 (7.3) (15.2) (8.2) 7.9
1970 13.4 4.8 (7.3) 8.6
1971 18.2 6.1 (10.0) 12.1
1972 11.8 14.6 2.8 (2.8)
1973 (8.9) (16.6) (8.1) 7.7
1974 (16.4) (27.6) (13.1) 11.2
1975 36.4 38.3 1.7 (1.9)
1976 5.1 17.9 12.5 (12.8)
1977 (6.1) (17.3) (11.7) 11.2
1978 7.0 (3.1) (9.2) 10.2
1979 0.5 4.2 4.0 (3.7)
1980 9.6 14.9 5.2 (5.4)
1981 (1.9) (9.2) (7.2) 7.3
1982 6.3 19.6 12.9 (13.3)
1983 10.3 20.3 9.3 (9.9)
1984 3.1 (3.7) (6.3) 6.8
1985 19.4 27.7 7.2 (8.2)
1986 10.9 22.6 10.9 (11.7)
1987 22.3 2.3 (16.2) 20.1
1988 13.1 11.8 (0.8) 1.2
1989 19.2 27.0 6.9 (7.8)
1990 13.1 (4.3) (15.2) 17.4
1991 28.2 20.3 (5.9) 7.9
1992 7.7 4.2 (3.0) 3.6
1993 13.5 13.7 0.5 (0.2)
1994 11.4 2.1 (8.0) 9.2
1995 29.7 33.5 3.2 (3.7)
1996 9.8 26.0 15.1 (16.2)
1997 34.0 22.6 (8.2) 11.4
1998 5.8 16.1 10.1 (10.3)
1999 23.6 25.2 1.6 (1.6)
2000 0.9 (6.2) (6.7) 7.1
2001 3.1 (7.1) (9.6) 10.2
2002 (7.7) (16.8) (9.5) 9.0
2003 36.1 25.3 (7.7) 10.8
2004 6.5 3.1 (2.8) 3.3
2005 2.8 (0.6) (3.0) 3.4
2006 13.3 16.3 3.0 (3.0)
2007 3.2 6.4 3.4 (3.2)
2008 (13.8) (33.8) (23.0) 20.1
2009 18.1 18.8 0.9 (0.8)
2010 17.3 11.0 (5.0) 6.2
2011 7.3 5.5 (1.3) 1.8
2012 9.7 7.3 (1.9) 2.4
2013 23.9 26.5 2.4 (2.6)
2014 (6.4) 7.5 15.3 (14.0)
2015 9.6 (2.2) (10.6) 11.9
2016 11.2 13.4 2.3 (2.2)
2017* 13.1 18.3 4.8 (5.1)

Figure 4 – Annual % +/(-) for ABD System versus Buy-and-Hold

*thru 10/31/2017

Jay Kaeppel

Disclaimer:  The data presented herein were obtained from various third-party sources.  While I believe the data to be reliable, no representation is made as to, and no responsibility, warranty or liability is accepted for the accuracy or completeness of such information.  The information, opinions and ideas expressed herein are for informational and educational purposes only and do not constitute and should not be construed as investment advice, an advertisement or offering of investment advisory services, or an offer to sell or a solicitation to buy any security.


Some Days Really are Worse than Others

Some days are great. Some days are awful. Some days fall somewhere in between the two extremes.  Wouldn’t it be nice if we could eliminate some of the awful days? Unfortunately, in life too often the awful days end up taking us by surprise.

The same holds true to an extent in the stock market – great days, awful days and everything in between.  The one difference – as it turns out – is that we may be able to identify some of the bad days in advance.

Trading Days Best Missed

For our purposes we will count the first trading day of the month as TDM 1, the second as TDM 2 and so on.

We will also count backwards from the last trading day of the month as follows: The last trading day of the month is TDM -1, the next to last day is TDM -2 and so on.

Here are the Trading Days Best Missed:

*TDM 13 through TDM 16

*TDM -10 through TDM -5

Note that there is invariably some overlap between these two periods. For example, during September 2017 TDM -10 through -5 extended from 9/18 through 9/25 while TDM 13 through 16 extended from 9/20 through 9/25.

Still, there is no “guesswork”. One simply counts the trading days for a given month – backwards and forwards – and notes the “seasonally unfavorable” days as days to avoid the stock market.

The Test

For our test we will hold the Dow Jones Industrial Average on all days that DO NOT fall between TDM 13 through 16 nor through TDM -10 through -5.

During those days we will hold cash, earning 1% interest per year.

Obviously, this “system” involves trading in and out every month. Is it worth it to trade so often?  Let’s look at the results and you can decide for yourself.

The Results

Figure 1 displays the growth of $1,000 invested in the Dow Jones Industrials Average ONLY on the “bad days” spelled out above since 1945.1Figure 1 – Growth of $1,000 invested in DJIA ONLY during TDM 13 through 16 and TDM -10 through -5; 12/31/1945-10/30/2017

Figure 2 displays the growth of $1,000 invested in the Dow Jones Industrials Average all days NOT included in the bad days spelled out above (blue line) versus $1,000 invested in the Dow on a buy-and-hold basis (red line). 2Figure 2 – Growth of $1,000 invested in DJIA during all “not bad” days plus 1% annualized interest when out of the market (blue line) versus buying-and-holding (red line); 12/31/1945-10/30/2017

For the record:

*Buying and holding the Dow during ALL trading days since 1945 produced a gain of +12,003%

*Buying and holding the Dow ONLY during TDM 13 through 16 AND TDM -10 through -5 produced a loss of -82%

*Buying and holding the Dow ONLY during all other days produced a gain of +81,661% (or 6.8 times that of buy-and-hold)

Summary

Most investors are not enamored with the idea of trading in and out of the stock market each and every month.  Which I get.  Still, the relevant question is “If you knew in advance when a bad day was coming (psst, in terms of the stock market, the results presented here suggest that maybe we do), would you do something about it?”

It’s a fair question.

Jay Kaeppel

Disclaimer:  The data presented herein were obtained from various third-party sources.  While I believe the data to be reliable, no representation is made as to, and no responsibility, warranty or liability is accepted for the accuracy or completeness of such information.  The information, opinions and ideas expressed herein are for informational and educational purposes only and do not constitute and should not be construed as investment advice, an advertisement or offering of investment advisory services, or an offer to sell or a solicitation to buy any security.