In a recent series of articles (here, here and here) I wrote about certain days of the month that appear to be worse than others for the overall stock market. The same is true for many stock market sectors. Take the electronics-related sector, for example.
Bad Days for Semi’s/Electronics
For testing purposes we will use ticker FSELX (Fidelity Select Electronics). However, because FSELX has switching restrictions another vehicle would need to be used for actual trading (see list of candidates further below).
Here are the “Bad Days” of the month for Electronics:
*Trading Days #5, 6 and 7
*Trading Days #13 and 14
*Trading Days -7, -6, -5
(The last trading day of the month is considered -1, the day before that -2 and so on)
How bad are they?
Figure 1 displays the growth of $1,000 invested in FSELX only on TDM 5, 6 and 7 Figure 1 – FSELX on TDM 5, 6 and 7; 9/30/1988-11/7/2017
Figure 2 displays the growth of $1,000 invested in FSELX only on TDM 13 and 14 Figure 2 – FSELX TDM 13 and 14; 9/30/1988-11/7/2017
Figure 3 displays the growth of $1,000 invested in FSELX only on TDM -7, -6 and -5 Figure 3 – FSELX TDM -7, -6, -5; 9/30/1988-11/7/2017
Figure 4 combines all 3 “Bad Day” periods. Figure 4 – FSELX TDM 5, 6, 7, 13, 14, -7, -6, and 5; 9/30/1988-11/7/2017
*From October 1988 into March 2000 FSELX gained +128% during the “Bad Days”, albeit in extremely volatile fashion.
*From March 2000 into May 2016, FSELX lost -94% during the “Bad Days”
*Since May 2016 FSELX has gained +36% during the “Day Days”
So no one should assume that FSELX is “doomed” to decline during these days.
Still, a net result of -81% is a net result of -81%.
The “All Other” Days
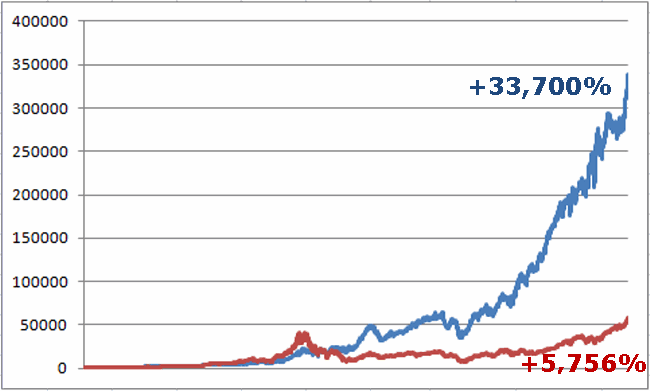
Figure 5 displays the growth of $1,000 invested in FSELX on ALL OTHER trading days each month since October 1988 versus buying and holding FSELX. Figure 5 – Growth of $1,000 invested in FSELX during “All Other Days” versus Buy-and-Hold; 9/30/1988-11/7/2017
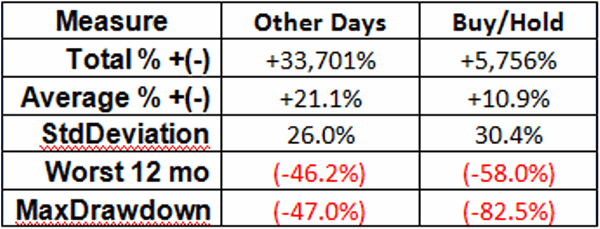
The comparative results appear in Figure 6 Figure 6 – Avoiding the “Bad Days” versus Buy-and-Hold; Sep88-Nov2017
Alternative funds
Figure 7 – generated using the MatchMaker function in AIQ TradingExpert – displays a variety of funds and/or ETFs with a high correlation to ticker FSELX. Most of these can be traded with no restrictions.
Figure 7 – Alternative Funds/ETFs (Courtesy AIQ TradingExpert)
Summary
At first blush, the big returns generated by missing the “Bad Days” are pretty compelling. Still, if we dig deeper there are questions to be answered.
The “Other” days underperformed buy-and-hold significantly into the Year 2000, and also since May 2016. Also, one may question whether trading only the “Other” days is really a viable approach. Consider:
*We are talking about at least 2 and sometimes 3 trades every single month no matter what
*The maximum drawdown (-47%) – while less than that of a buy-and-hold approach (-82.5%) – is well beyond the comfort zone for most traders
*This “System” – such as it is – can (and will) significantly underperform buy-and-hold over extended periods of time.
As always, I do not offer trading advice here, only information. While there are questions to answers and doubt to overcome in this case, still a return of +33,700% using a completely objective approach versus +5,756% using buy-and-hold may be worthy of further research.
Jay Kaeppel
Disclaimer: The data presented herein were obtained from various third-party sources. While I believe the data to be reliable, no representation is made as to, and no responsibility, warranty or liability is accepted for the accuracy or completeness of such information. The information, opinions and ideas expressed herein are for informational and educational purposes only and do not constitute and should not be construed as investment advice, an advertisement or offering of investment advisory services, or an offer to sell or a solicitation to buy any security.

