I’ve been reading a lot of “bullish talk” regarding crude oil of late. And I think that there might be something to it. However, I for one will probably hold off on jumping on the bullish bandwagon for just a little while longer.
One the One Hand
Figure 1 displays the spot price for crude oil with key support and resistance levels highlighted. Until price breaks out of this range all predictions are just that – predictions.
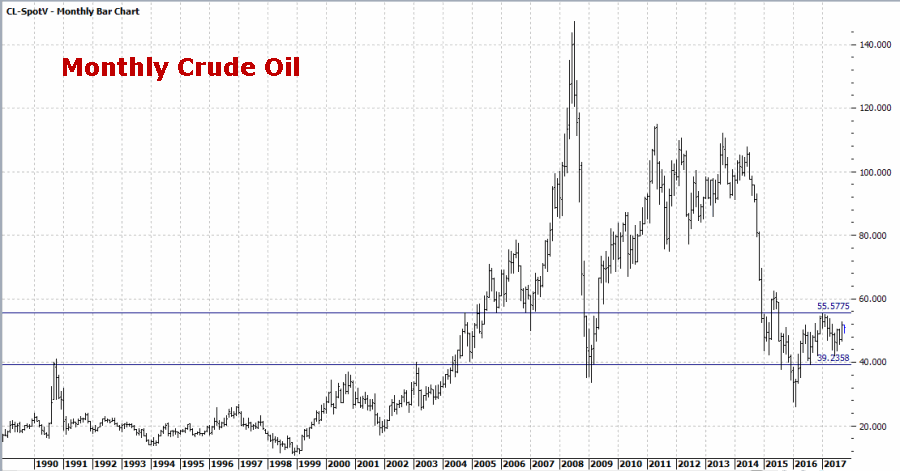 Figure 1 – Monthly Crude Oil (Courtesy ProfitSource by HUBB)
Figures 2 and 3 show weekly and daily crude oil charts with the Elliott Wave counts from ProfitSource by HUBB. Note that the weekly put in a Wave 5 bottom a while back and the daily is now suggesting an impending 5th wave up.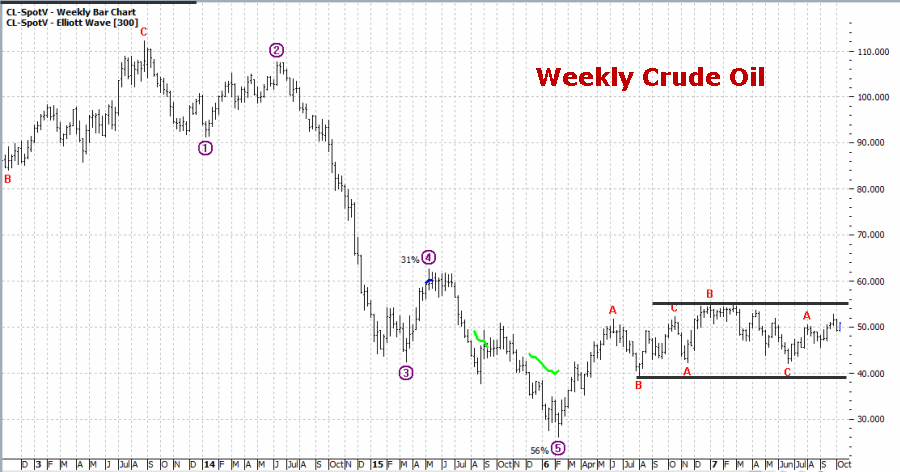 Figure 2 – Weekly Crude Oil (Courtesy ProfitSource by HUBB)
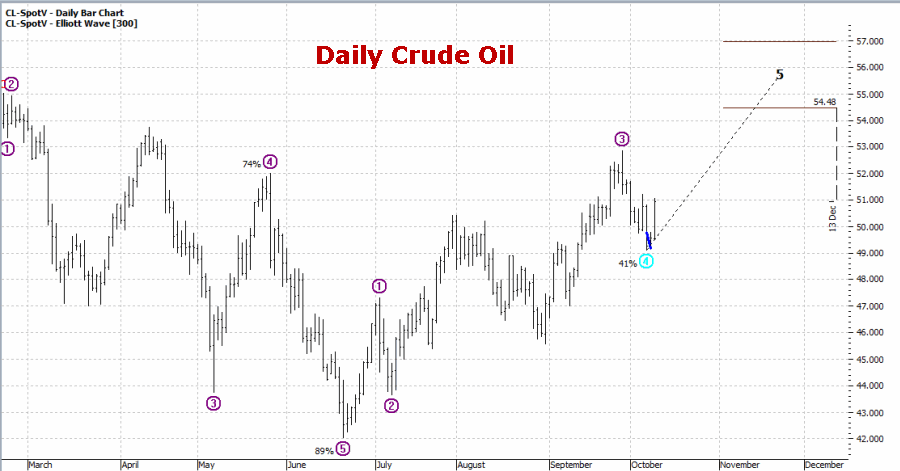 Figure 3 – Weekly Crude Oil (Courtesy ProfitSource by HUBB)
The caveat here is that EW wave counts can and do change and the counts presented in Figures 2 and 3 in no way “guarantee” that a rally is in the offing. But Figures 1 through 3 do illustrate why there is a lot of “bullish talk” regarding crude oil.
On the Other Hand
The historical performance of crude oil suggests that this may not be the ideal time to pile onto the bullish side. Figure 4 displays the Annual Seasonal chart for crude oil futures since they started trading in 1983.
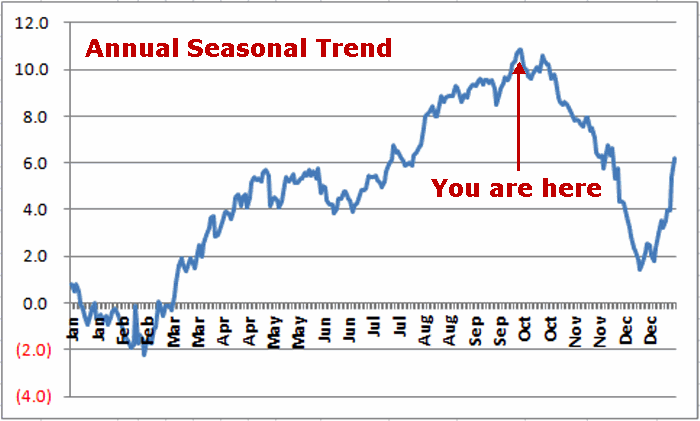 Figure 4 – Crude Oil Annual Seasonal Trend
It is important to note that Figure 4 is NOT a “roadmap” and that prices do not simply follow this pattern year in and year out. Historically through, crude has been a very “seasonal” market and it often is useful to know whether the current predominant seasonal trend is up or down. The seasonal trend has been up since mid-June – which as you can see in Figure 3 coincided with the most recent low in price.
The next significant seasonal period is bearish and extends from the close on October Trading Day #9 (which is Thursday 10/12) through the close on December Trading Day #8 (which is Tuesday 12/12). As with any seasonal trend there is no guarantee that crude will decline in price between these dates. Still, consider the historical performance of crude oil during this period as displayed in Figures 5 and 6
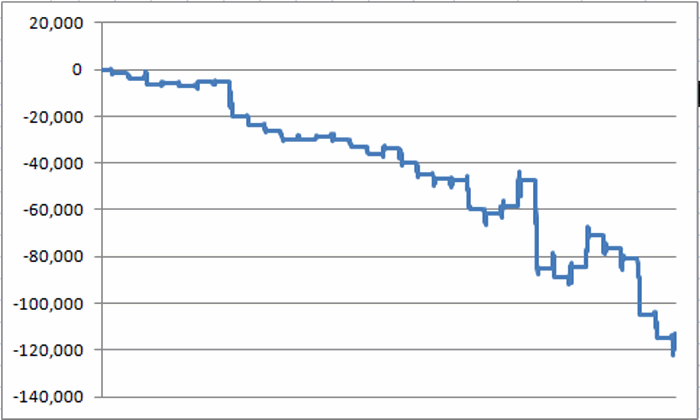 Figure 5 – $ gained (lost) holding a long 1-lot position in crude oil futures from Oct TDM 9 through Dec TDM 8 (1983-present)
Figure 6 displays a summary of crude oil performance during this particular seasonal period.
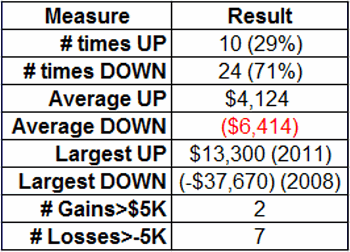
Figure 6 – Crude oil performance; Oct TDM 9 through Dec TDM 8 (1983-present)
Summary
Please remember that I am not urging anyone to play the short side of crude. I am merely pointing out why I am hesitating to play the bullish side. Crude oil has historically been one of the more reliable seasonal markets. But remember that nothing can be counted on 100%. Even the highlighted awful, terrible, no good, very bad October into December period has seen crude show a gain almost 30% of the time.
The bottom line: If the bullish case plays out I will miss out on an opportunity (It wouldn’t be the first time). Nevertheless – and despite what anyone may say – investing and trading really is about playing the odds. For the next several months the odds appear not to favor the bulls in crude.
Jay Kaeppel
Disclaimer: The data presented herein were obtained from various third-party sources. While I believe the data to be reliable, no representation is made as to, and no responsibility, warranty or liability is accepted for the accuracy or completeness of such information. The information, opinions and ideas expressed herein are for informational and educational purposes only and do not constitute and should not be construed as investment advice, an advertisement or offering of investment advisory services, or an offer to sell or a solicitation to buy any security.

