This article is for people who “trade” (i.e., we are not talking long-term buy-and-hold here) or who are interested in trading.
Please note that what follows is essentially an “example of one potential approach” and NOT a “You can’t lose in trading by following these exact steps specifically laid out here”. Are we clear? OK, then let’s proceed.
One Potential Route
Options offer a great way for speculators to, well, speculate – what else, while committing less capital than they might have to in order to buy shares of stock or hold futures contracts. They also are useful in helping traders to limit their risks to a specific amount.
What follows is a set of steps that may be useful if the stock market continues its “every little dip is a buying opportunity to be followed shortly by higher stock prices overall very soon” ways. This trend will not last forever. You have been warned.
The Gist
The gist of the idea is this:
*When the overall market pulls back
*Look for stocks/ETFs with good option volume and tight option bid/ask spreads
*Among those stocks, identify those that are in an uptrend and have also experienced a recent pullback
*From those stocks, find the best mathematical opportunities for profiting using options if in fact the price of the stock rises in the near future (in this case “near future” is roughly defined as “the next several months” – which for the record, is not everyone’s definition of “short-term speculation”).
From here we will use www.OptionsAnalysis.com
Step 1: Wait for a pullback in the overall stock market
There are at least a bazillion and one ways that traders may use to designate a “pullback”. This is just one example (in the interest of CYA, please note that no assumption should be made that this simple technique will generate future profits. Recently, every short pullback inthe stock market has reversed relatively quickly without much follow through to the downside. This WILL NOT last forever).
Figure 1 shows the S&P 500 Index with a 200-day moving average and a 4-day RSI. For our purposes we are looking for the S&P500 to be above the 200-day moving average and the 4-day RSI to be below 25. The most recent occurrence was 8/17/17. igure 1 – SPX > 200-MA; 4-day RSI<25 (Courtesy AIQ TradingExpert)
Step 2: Identify Stocks/ETFs with active option trading
In OA we go to Website | Lists | Filter List. There I have setup a template that scans all optionable stocks and ETFs to find those that trade at least 1,000 option contracts a day AND whose options have bid/ask spreads of 1% or less. The Output list appears in Figure 2. These 89 tickers are saved to My Stock List. Figure 2 – Filter List Output (Courtesy www.OptionsAnalysis.com)
Step 3: Identify Stocks/ETFs in an Uptrend
In OA we go to Stocks | Rankers | Moving Averages and run a ranking of the 89 tickers in My Stock List to find only those that are presently above their own 200-day moving average (i.e., in an uptrend). In Figure 3 we see that 67 of the 89 tickers qualified. So we overwrite My Stock List with just those 67 tickers. Figure 3 – OA Moving Average Ranker (Courtesy www.OptionsAnalysis.com)
Step 4: Identify Stocks/ETFs that have experienced a pullback
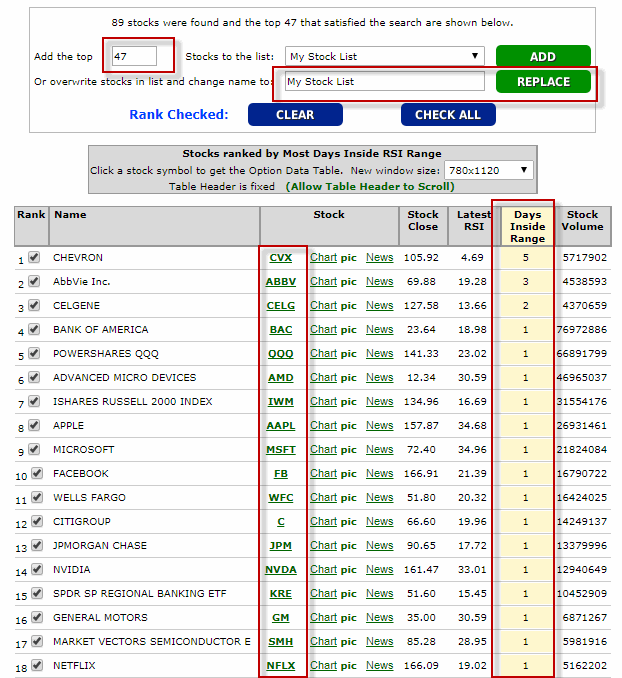
In OA we go to Stocks | Rankers | RSI and run a ranking to find tickers in My Stock List whose 3-day RSI has been below 35 sometime during the last 5 trading days. The input screen is in Figure 4 and the output is in Figure 5. 47 of the tickers have experienced pullback. Figure 4 – RSI Ranker Inputs (Courtesy www.OptionsAnalysis.com)
 Figure 5 – RSI Ranker Outputs (Courtesy www.OptionsAnalysis.com)
Step 5: Search Option trades with the best mathematical expectation
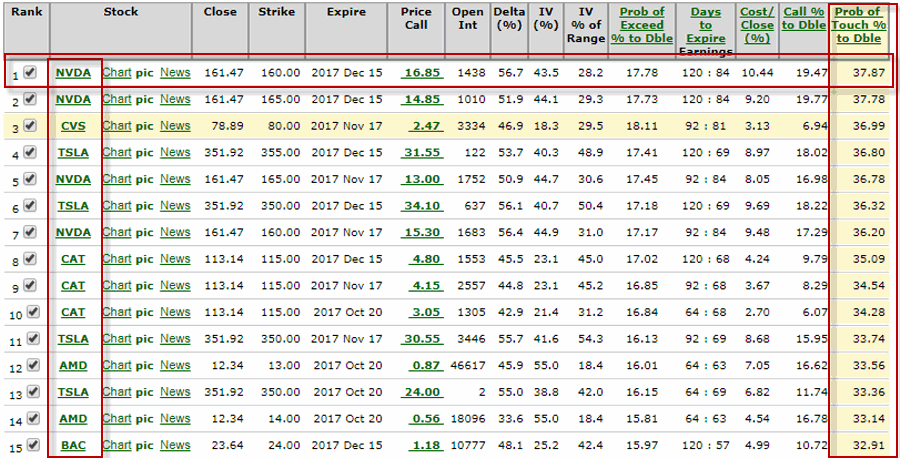
In OA we go to Search | Single Strategy | Percent to Double. Here we search the remaining 47 tickers for call options that have the highest probability of touching their respective “Percent to Double” target (Percent to Double tells you approximately how far the stock must rise in order for the call option to double in price. “Probability of Touch” measures the probability of that actually happening). The output screen appears in Figure 6. Figure 6 – Percent to Double Output (Courtesy www.OptionsAnalysis.com)
The December 160 NVDA call appears at the top of the list (time for more CYA: NO IMPLICATION is being suggested that the trade that appears at the top of this list is certain or even likely to generate a profit. Again, this is just an example of one way to filter down for potential opportunities).
Buying 1 NVDA Dec 160 call would cost $1,675. Figure 7 displays the particulars, Figure 8 displays the risk curves. Figure 7 – (Courtesy www.OptionsAnalysis.com)
 Figure 8 – (Courtesy www.OptionsAnalysis.com)
The equation is pretty straightforward – either NVDA advances in price over the next 120 calendar days and the option has a chance of making money or the option loses money.
The status of this hypothetical position as of the close on 9/18 appears in Figure 9. Figure 9 – NVDA Dec 160 call (Courtesy www.OptionsAnalysis.com)
Summary
Things absolutely, positively DO NOT always work out as this example did.
The real lesson is recognize that a reasonably well thought out series of steps will generally offer a trader better potential for long-term success than just “winging it.”
Jay Kaeppel
Disclaimer: The data presented herein were obtained from various third-party sources. While I believe the data to be reliable, no representation is made as to, and no responsibility, warranty or liability is accepted for the accuracy or completeness of such information. The information, opinions and ideas expressed herein are for informational and educational purposes only and do not constitute and should not be construed as investment advice, an advertisement or offering of investment advisory services, or an offer to sell or a solicitation to buy any security.


Jay: I enjoyed the article and plan to dig into it. Would you answer this question.
I trade a mean reversion system where I purchase QQQ shares at the close on the Buy date and sell the ETF shares on the close of the sell date. I would like to trade QQQ calls rather than committing large sums to QQQ or TQQQ. The trades last 5-35 mkt days & I thought just in the money calls w a 2 month expiration was appropriate. What kind of leverage am I using here. For a $100,000 QQQ trade I’d be buying 7, QQQ171215C144 contracts. Does this seem right. I’d love your feedback on this.
Thanks
Alan
Alan
Alan, two things: 1) Using options instead of shares is fine but you do need to consider the types of returns you tend to get on the shares. If you buy shares and QQQ goes up 1% in 35 days you make 1%. If you buy an option comprised mostly of time premium, if the shares go up 1% you typically will lose money on that option due to time decay. 2) For “stock replacement” strategy I typically would want to go as deep in the money as I can stomach (more cost, less leverage and often wider spreads) in order to minimize the negative effect of time decay. I’m talking a delta in the area of 80 – again, you do need to consider the size of the bid/ask spread but QQQ is a reasonable candidate for this type of trading. Buying deep-in-the-money is against the grain for alot of traders (as they are generally looking for more leverage) but what you really want is as close to point-for-point movement with the shares as you can get at a lower cost than buying the shares. Hope that helps. Jay.
Only question I have on your strategy is do you use the default settings for: Search | Single Strategy | Percent to Double ? Things worked just fine. Great explanation.
I am not sure if it is the default setting or not but just for the record I select “Probability of Touch % to Double” rather than “Lowest % to Double”. Can’t quantitatively say that it is “better” but it tends to ind options with deltas of 40 or more rather than the “long shots” with deltas of 30 or less. Just a personal preference – a little less leverage but a slightly higher probability of doing “something” than a really far OTM option. Jay
Jay:
Thanks for the quick replies. OptionsAnalysis is great, if not a bit complicated but I can now follow my trading outputs using Options rather than ETF’s. The just in the money calls, 2 mos out for QQQ require ~ 14 contracts for a $100,000 QQQ position w just in the money calls. Returns are similar. I’m not sure there is really an advantage to using options rather than ETF’s x it ties up less money.