Now seems like a good time for on an update on a simple trading technique I stumbled upon a good while back. Like every other trading “technique” it has its good points and its drawbacks. But since my mission here is to share “ideas” – with no intimations that anything is ever guaranteed to work – here is the latest.
I first wrote about this pattern here with a clarification here and an update here. It was primarily designed to use with stock index futures and I have done only limited testing with other markets. In a nutshell:
The stock index should be trading above its 200-day moving average
Day 1: sees the index close below the previous day’s low
Day 2: has no meaning other than to record the high of the day
Day 3: buy if the index exceeds the Day 2 high on Day 3, otherwise the signal is deactivated.
Exit on the 1st profitable close after entry.
That’s it. There is also a matter of whether or not to use a stop and how far away that stop should be. But for today we will simply focus on the pattern itself.
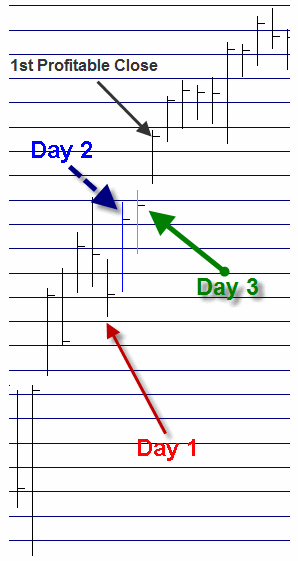
Figure 1 is one example of this pattern playing out.
Figure 1 – “The Pattern” (Courtesy AIQ TradingExpert)
Day 1 – the close is below the previous day’s low
Day 2 – the day after Trading Day 1
Day 3 – price breaks above Day 2 high triggering a long trade
1st profitable close occurs on day after Day 3
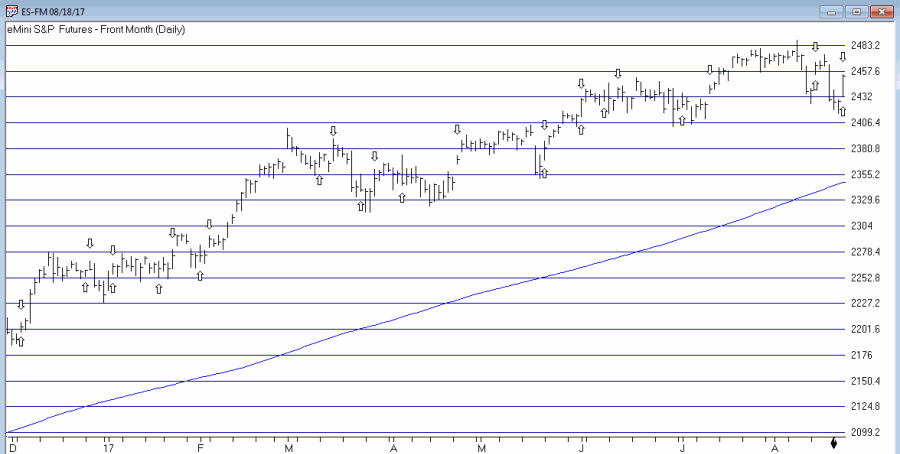
Figure 2 below displays a bar chart of the eMini S&P 500 front month contract with the trades since December 2016.
(click to enlarge) Figure 2 – eMini S&P Front Month with “The Pattern” (Courtesy AIQ TradingExpert)
NOTES:
*”Up” arrows indicate a Day 3 entry
*”Down” arrows are “exit” signals and NOT sell short signals
The good news is that during this period “The Pattern” has generated 14 “wins” with 0 “losses”. 14 consecutive wins in anything is definitely an attention grabber. However, this “test” employs:
*1-lot positions
*No stop-loss provision
*No deductions for slippage or commissions
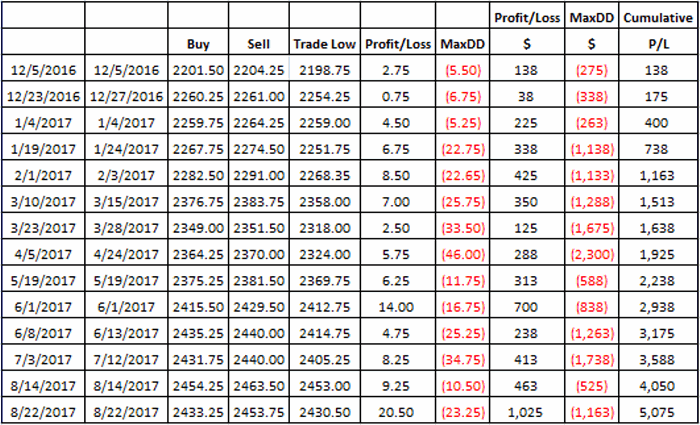
Figure 3 below displays the hypothetical trade-by-trade results using 1-lot position – again assuming no slippage or commissions. Figure 3 – Hypothetical trade-by-trade since Dec 2016
Again, the good news is the consistency of the pattern in terms of identifying buying opportunities. The real question though (as with all things trading) is “Do the rewards justify the potential risks?” To illustrate this point note – for example the trade entered on 4/5/17 and exited on 4/24/17. On paper the trade generated a profit of +$288 (before slippage and commissions). However,we see in the next to last column that a trader would have had to sit through a drawdown of -$2,300 along the way in order to realize that profit.
Sometimes 14 and oh isn’t as clear cut as it seems.
Summary
If this pattern is at all intriguing to you:
1) Do some homework on your own before even considering actually using it to trade
AND
2) Make sure to seriously address the “risk” question above.
Jay Kaeppel
Disclaimer: The data presented herein were obtained from various third-party sources. While I believe the data to be reliable, no representation is made as to, and no responsibility, warranty or liability is accepted for the accuracy or completeness of such information. The information, opinions and ideas expressed herein are for informational and educational purposes only and do not constitute and should not be construed as investment advice, an advertisement or offering of investment advisory services, or an offer to sell or a solicitation to buy any security.


Hello Jake
Have you investigated if this pattern shows up in other markets ?
Manuel
Jay, first of all sorry for calling you Jake. I have read your other articles regarding this pattern and I have found the answer.
Thanks
Manuel