I read a piece this morning where some analyst was calling for a rally in energy stocks. It’s a guts call. And he may be right. But for some reason, whether it is producing/consuming it or simply investing in it, it seems like nothing is ever easy when it comes to energy.
Energy versus Jay’s Anti U.S. Dollar Index
I follow an index I made up using ETFs that are inversely correlated to the US dollar. Turns out it is not the worst energy stock barometer in the world.
The index is referred to as ANTIUS3 and is comprised of the following tickers:
FXE – Euro Currency Trust
FXF – Currency Shares Swiss Franc
IBND – SPDR Bloomberg Barclays International Corporate Bonds
IGOV – iShares International Treasury Bonds
UDN – PowerShares U.S. Dollar Index Bearish
Figure 1 displays my ANTIUS3 index in the bottom clip with a 5-week and 30-week moving average added and Fidelity Select Energy (FSENX) in the bottom clip. Just a cursory glance reveals that ANTIUS3 typically (though far from always) serves as a leading indicator for energy stocks. In other words, when the 5-week MA in the top clip is above the 30-week MA in the top clip FSENX (in the bottom clip) tends to rise and vice versa. Figure 1 – Jay’s Anti U.S. Dollar Index versus ticker FSENX (Courtesy AIQ TradingExpert)
Figure 2 displays the growth of $1,000 invested in FSENX only when:
a) The ANTIUS3 5-week MA > 30wk MA
b) The ANTIUS3 5-week MA < 30wk MA
 Figure 2 – Growth of $1,000 invested in FSENX when system is “bullish” (blue) versus “bearish” (red); 3/1/2007-7/14/2017
As you can see in Figure 2 the ANITUS3 5wk/30wk “system” does not exactly qualify as “precision market timing.” Still, consider the overall results:
*When the ANTIUS3 5wkMA > 30wkMA FSENX gained +187% (i.e. system is “bullish”)
*When the ANTIUS3 5wkMA < 30wkMA FSENX lost -66% (i.e. system is “bearish”)
That’s not terribly shabby for an admittedly very crude approach.
The most recent “signal” was a “Buy” on 4/28/17 but FSENX slid another 10% into June before “sorta, kinda” bouncing since then (See right hand side of Figure 2).
So where to from here? Per usual, I have to go with my stock answer of “it beats me.” (Sorry folks, but predictions are not my strong suit). Some thoughts:
*Energy stocks may well bounce higher in the near term, however, you have to be comfortable with (and preferably experienced at) being a countertrend trader in order to take a bullish position at this moment.
*From a seasonal standpoint this is typically not the ideal time to pile into energies.
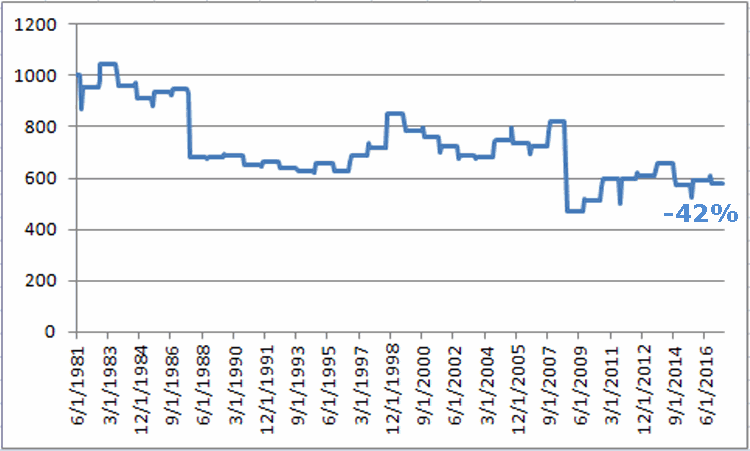
During the month of August ticker FENX has generated a cumulative gain of +47% since it started trading in 1981. However, as shown in Figure 3 – during September, October and November FSENX has lost a cumulative -42%. At the same time, Figure 3 shows that FSENX “can” rally sharply during these months. But the long-term odds are not favorable. Figure 3 – Growth of $1,000 invested in ticker FSENX ONLY during September, October and November; 6/1/1981-present
In sum:
*If you think that energy stocks are oversold and due for a bounce, you may be right and a trade on the long side might pay off (I suggest options on ticker XLE).
*If you are not so gung ho you might consider waiting to see what things look like closer to the end of November.
Jay Kaeppel
Disclaimer: The data presented herein were obtained from various third-party sources. While I believe the data to be reliable, no representation is made as to, and no responsibility, warranty or liability is accepted for the accuracy or completeness of such information. The information, opinions and ideas expressed herein are for informational and educational purposes only and do not constitute and should not be construed as investment advice, an advertisement or offering of investment advisory services, or an offer to sell or a solicitation to buy any security.


Good article. How about a re post end October with an update?