Seasonal trends can be found in many markets and stocks – the U.S. Dollar is no exception. For our purposes today we will keep it very simple and look at which months have typically been “good, bad or indifferent” for USD.
The Test
For testing purposes we will use ticker DXY from ProfitSource by HUBB as shown in Figure 1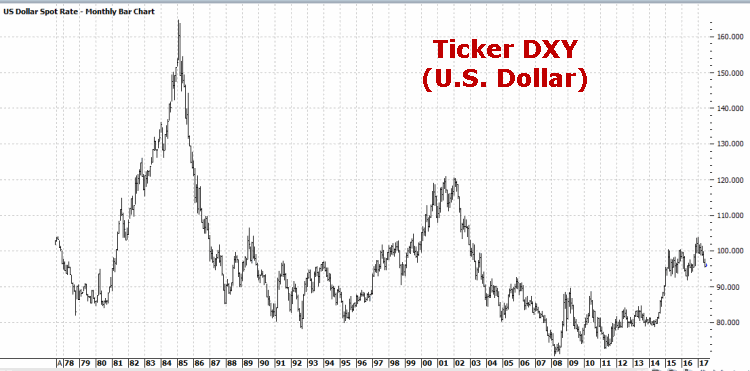
Figure 1 – Ticker DXY (U.S. Dollar 1977-2017) Courtesy ProfitSource by HUBB
In Figure 2 we find the following:
*3 Best Months = January, May and November
*3 Worst Months = April, September and December
*“Other” Months = February, March, June, July, August and October
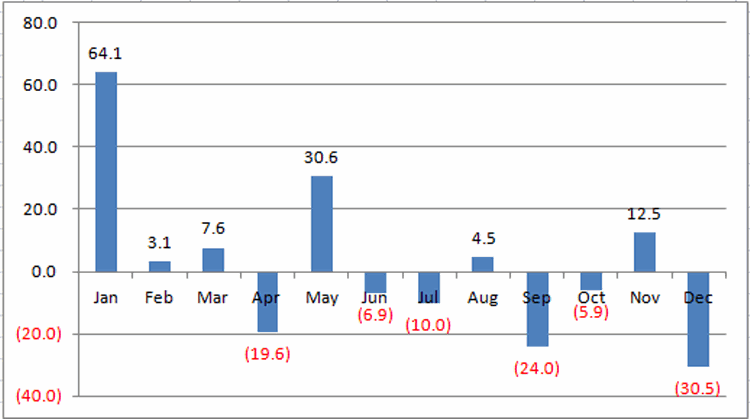 Figure 2 – Cumulative DXY % Gain Month-by-Month (1977-present)
Figure 3 displays the growth of $1,000 invested in ticker DXY during each of the three periods listed above.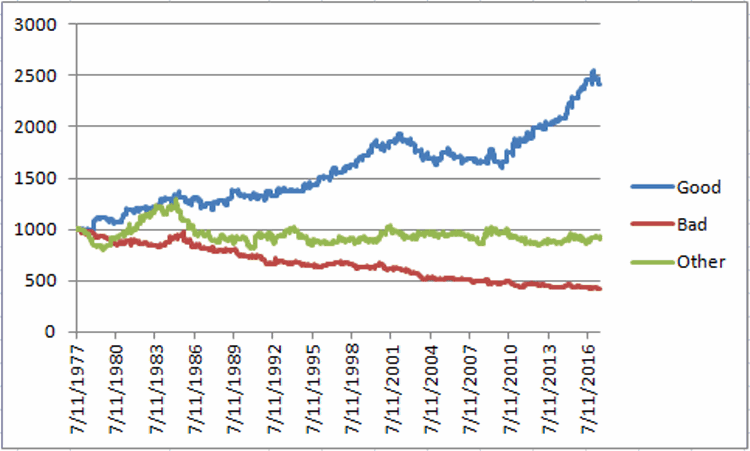
Figure 3 – Growth of $1,000 invested in DXY Good Months (blue), Bad Months (red) and Other Months (green); 1977-present
From Theory to Practice
Traders looking to actually use this information should:
*Determine whether or not they believe there is enough here to really go on.
*Focus on US dollar and inverse US dollar funds and/or ETFs including RYSDX, RYWDX, RDPIX, FDPIX and UUP and UDN.
RYSDX and RYWDX are open-end mutual funds that trade the dollar long (or short) using leverage of 2-to-1. RDPIX and FDPIX do the same without using leverage and UUP and UDN are ETFs that trade the dollar long and short with no leverage.
Figure 4 displays the growth of $1,000 using monthly total return data for tickers RYSDX and RYWDX since they starts trading in May 2005, using the following method:
*Long RYSDX (i.e., long the U.S. Dollar) during Jan, May and Nov
*Long RYWDX (i.e., short the U.S. Dollar) during Apr, Sep and Dec
*In Cash (earning 1% annually) during all other months
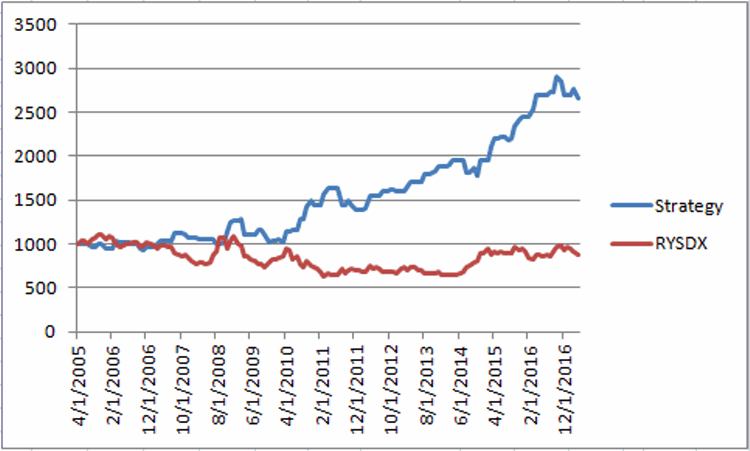 Figure 4 – Growth of $1,000 trading “Good” and “Bad” Months using tickers RYSDX and RYWDX (blue) versus buying-and-holding RYSDX (red); 2005-present
The bottom line:
*$1,000 invested as described grew to $2,656 (+166%)
*$1,000 invested in RYSDX using buy-and-hold declined to $883 (-12%)
*The average annual % gain using our trading model was +10.4%
*The average annual % loss holding RYSDX was (-0.1%)
*The trading method showed a 12-month gain 84% of the time
*Buying and holding RYSDX showed a 12-month gain 43% of the time
Summary
Is this actually a tradable model? That’s not for me to say. I am just putting the idea out there. Still, given the consistent outperformance versus simply buying and holding the U.S. Dollar, it might at least be a good place to start looking.
Jay Kaeppel
Disclaimer: The data presented herein were obtained from various third-party sources. While I believe the data to be reliable, no representation is made as to, and no responsibility, warranty or liability is accepted for the accuracy or completeness of such information. The information, opinions and ideas expressed herein are for informational and educational purposes only and do not constitute and should not be construed as investment advice, an advertisement or offering of investment advisory services, or an offer to sell or a solicitation to buy any security.

