If you have read any of my stuff in the past then you probably know that I spend a lot of time trying to determine “what goes up (or down) when”. What follows are the results of one such test.
While the results are initially impressive on the face of it (if I do so say myself, and I think I just did) there are a number of important caveats. To put it another way, do NOT be impressed with the results WITHOUT first seriously considering some of the significant caveats mentioned below. To put it in the most standard terms possible – past results DO NOT guarantee future results.
See also Is The Santa Claus Rally Nigh?
The Test
*I looked at variety of assets classes (listed at the end of the article) using mutual fund data and/or index data from January 1993 through April 2007. The data was monthly total return data from Callan Associates.
*I’ve created my own proprietary formula for measuring performance during a specific month. The factors include: average monthly return, median monthly return, standard deviation, largest monthly decline and a variety of ratios amongst these factors (but I am a lot of fun at parties. No seriously.)
*I used my proprietary formula to rank performance for each asset class for each month and took my “top pick”. In a nutshell, the “top pick” is not the one that showed the largest average monthly gain but the one that showed the best tradeoff between risk and reward.
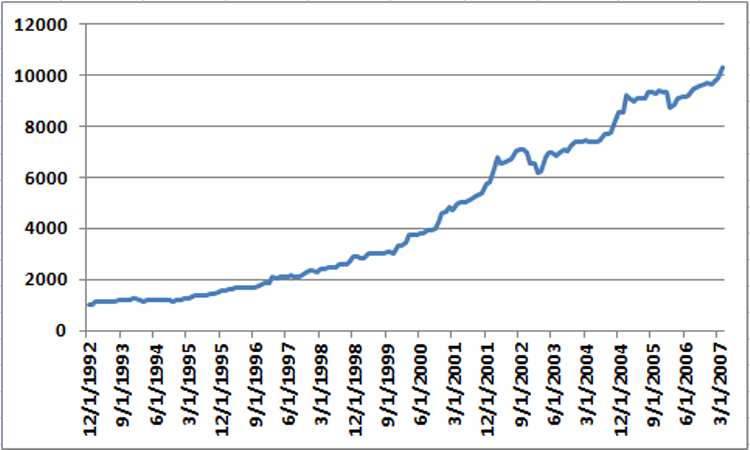
*I ran a backtest using mutual fund and/or index data for the top ranked asset for each month from January 1993 through May 2007. The results for Jay’s One Asset Class per Month strategy (heretofore JOAC) appear in Figure 1. Figure 1 – Equity Curve for Jay’s One Asset Class per Month Strategy; 12/31/92-5/31/2007
The average 12-month return was +17.8% and the maximum drawdown (using month-end data) was -12.7%
While the results look good it is now time for those dreaded “caveats”:
*These results could not be exactly duplicated in real trading for a couple of reasons: First, some of the results were generated using index data and not mutual fund data.
*Also, many of the mutual funds used in the test (particularly Vanguard and Fidelity funds) cannot be traded one month at a time. Most have a minimum holding period of 30 to 90 calendar days). So buying in one month and selling out the next would likely result in fees and/or future trading restrictions.
Moving Forward JOAC using ETFs
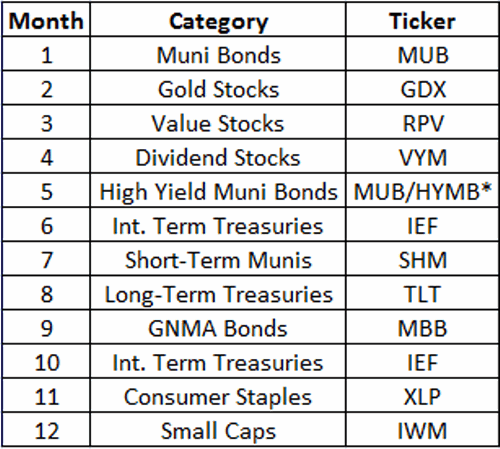
ETFs have no switching restrictions so starting in May 2007 I switched to an all ETF portfolio, using a particular ETF each month to attempt to track the top asset class for that month. That portfolio appears in Figure 2. 
Figure 2 – JOAC monthly ETF Portfolio
*-MUB traded in May 2007-2010; HYMB traded in May starting in 2011
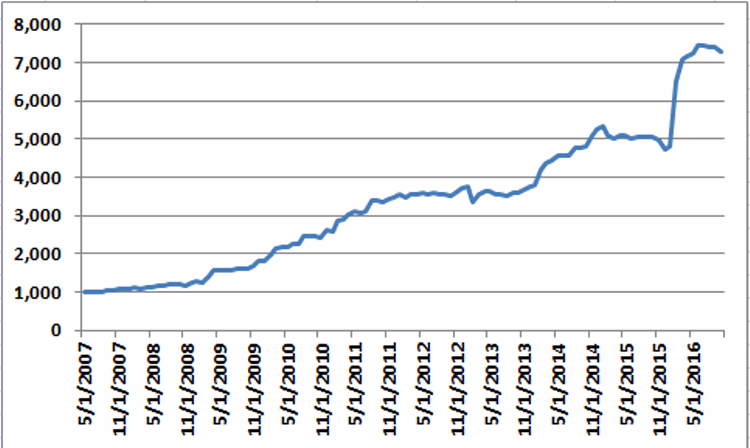
Once again using monthly total return data from Callan Associates I tested the 2007-2016 period using the tickers listed in Figure 2. The results appear in Figure 3.
 Figure 3 – Equity Curve for Jay’s One Asset Class per Month Strategy; 5/31/2007-10/31/2016
*The average annual gain starting in 2008 (the 1st full year of data) is +25.8%
*The maximum drawdown (using monthly data) is -11%.
Annual results in appear in Figure 4. These results do not include any transaction fees
Figure 4 – JOAC ETF Strategy Annual Results
*May 31st/2007-12/31/2007
So is this the greatest thing since sliced bread? Probably not. Why not? Time for more of those pesky caveats:
*Buying and holding only one ETF per month does not offer a lot of diversification (or any diversification at all for that matter)
*The test period using ETFs is relatively short
*Intramonth volatility and drawdowns will undoubtedly be greater than what appears in the Figures above
This strategy fits squarely in the “(almost certainly) high risk, (potentially) high reward” category.
Summary
So as I stated earlier, no one should assume that they can just start buying the ETFs listed above and start making 25% a year ad infinitum into the future. The results displayed in this article should probably be thought of more as a starting point for further analysis rather than a finished product.
In essence, the real point is that – as with all things – there is a time and a place or everything, including (apparently) asset classes.
Jay Kaeppel
| Categories |
| Consumer Staples Stocks |
| Dividend Stocks |
| Equal Weighted Stock Index |
| Gold Stocks |
| Russell 1000 Large Caps Index |
| Russell 2000 Small Caps Index |
| S&P 500 Index |
| S&P 400 MidCap Index |
| Stock/Bond Hybrid Fund |
| Utility Stocks |
| Growth Stocks |
| Value Stocks |
| GNMA Bonds |
| Int. Term Treasuries |
| Int. Term Treasuries |
| Junk Bonds |
| Long-Term Treasuries |
| Muni Bonds |
| Muni Bonds High Yield |
| Muni Bonds Intermediate-term |
| Muni Bonds Short-term |
| Muni Bonds Long-term |


interesting … any more information you are comfortable elaborating on in regards to evaluating and ranking performance – lookback periods? alpha/beta/sd/sharpe weightings in evaluation?