In Part I I sort of intimated that the bottom is about to drop out from under the stock market. And let’s face it – that is possible. But as I also mentioned, there is always countervailing information. To wit:
Why the Stock Market is About to Soar
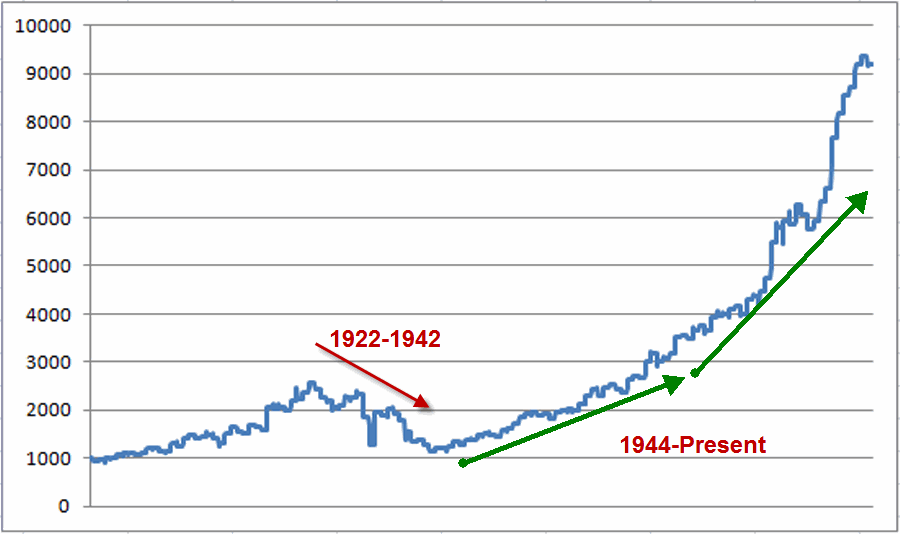
Getting a sell signal at the end of February is a little disconcerting simply because the March/April time period has historically been pretty good for stock market investors. Figure 1 displays the growth of $1,000 invested in the Dow Industrials Average only during the months of March and April, every year since 1886. Figure 1 – $1,000 invested in Dow during March/April (1886-2015)
A few notes regarding March/April:
Since 1886:
*Up 83 times (64%)
*Down 47 times (36%)
*Average “Up” = +6.12%
*Average “Down” = -5.13%
Things have improved a bit since 1944:
*Up 53 times (75%)
*Down 18 times (25%)
*Average “Up”= +5.16%
*Average “Down” = -3.28%
So there has been an upside bias historically during the March/April time frame. In addition, we have already seen a steep selloff in the stock market and a number of “overbought/oversold” indicators that I follow all reached “extremely oversold” territory. This type of action typically – though certainly not always – presages favorable stock market activity. Rather than showing you a bunch of different oscillators all with essentially the same “oversold” squiggly lines, let’s just highlight one of my favorites.
The JK HiLo Index
I first wrote about this indicator in the October 2011 issue of Technical Analysis of Stocks and Commodities magazine and I believe it is available via Bloomberg. The calculations are as follows:
A = the lower of Nasdaq daily new highs and Nasdaq daily new lows
B = (A / total Nasdaq issues traded)*100
C = 10-day average of B
D = Nasdaq daily new highs / (Nasdaq daily new highs + Nasdaq daily new lows)
E = 10-day average of D
JK Hi/Lo Index = (C * E) * 100
In a nutshell:
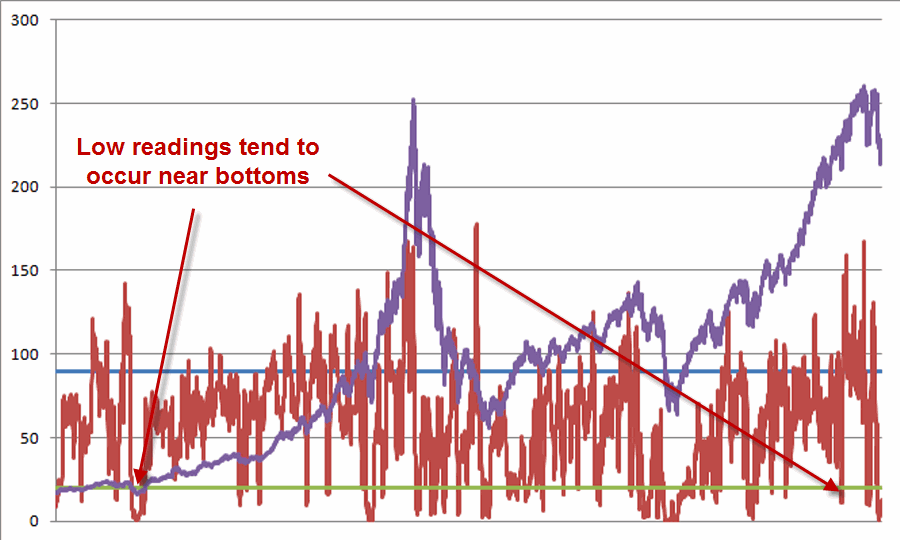
*High readings (90 or above) suggest a lot of “churning” in the market and typically serve as an early warning sign that a market advance may be about to slow down or reverse
*Low readings (20 or below) indicate a potential “washout” as it indicates a dearth of stocks making new highs
Figure 2 displays the Nasdaq Composite (divided by 20) with the JK Hi/Lo Index plotted since 1988.
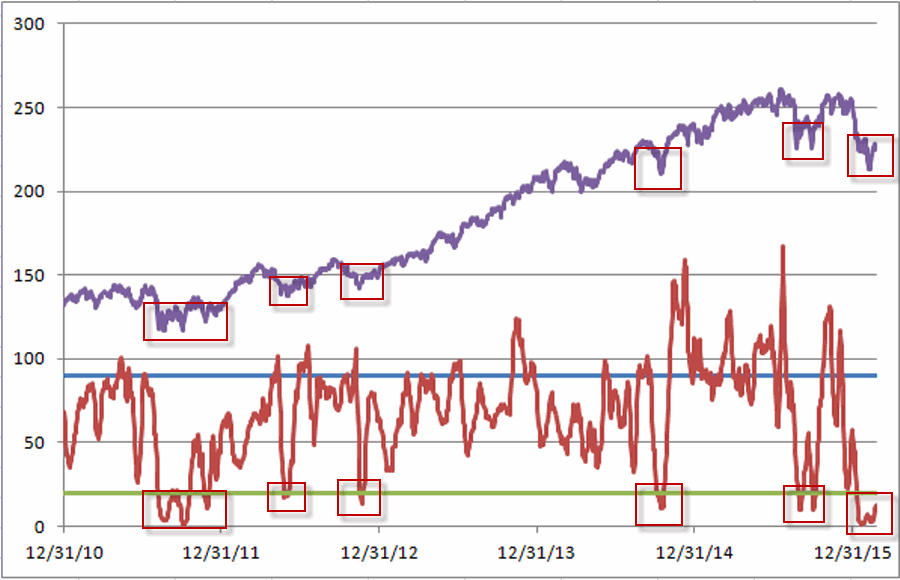
Figure 3 zooms in a bit to show the action since 2011
 Figure 2 – JK HiLo Index (red line) versus Nasdaq Composite (/20) since 1988
Figure 3 – JK HiLo Index (red line) versus Nasdaq Composite (/20) since 2011
As you can see, low indicator readings often occur near market lows.
So the market is:
A) Oversold (JK Hi/Lo Index recently bottomed out at 0.86 and presently stands at 12.5)
B) Heading into a typically bullish time period (March/April)
Given this, one might argue that the stock market is about to stage a meaningful advance. Which of course, flies directly in the face of what was presented in Part I.
Summary
So what should any trader or investor do given conflicting signals?
Simple…keep following your well thought out investment plan. You do have one, right? In any event, remember:
Jay’s Trading Maxim #2: The keys to trading and investment success are, A) utilizing a method or methods that have a realistic expectation of generating profits over the long run, and B) having the financial and emotional wherewithal to follow your method(s).
Jay Kaeppel


