Monthly Archives: July 2015

Of Biotech, Bunnies (and Parades and Rain?)

For the record, I own shares of Fidelity Select Biotech sector fund (FBIOX) and have for some time.  And I am glad for that.  Because they’ve done great.  All the more reason that I hate to potentially rain on my own parade.  Still….

As a side note, I personally do not trade off of chart patterns (although I know many people who do so quite successfully) but I do look t charts on a regular basis.  Every once in awhile I scroll through a list of all kinds of tickers (stock indexes, sector funds, bond related ETF, commodity, foreign stocks etc.) just to “get a feel” for what the heck is going on out there.  This exercise does not (typically) lead to specific “action” (as that would essentially be more “reactionary” and I am more o a systematic trader and investor), but it does cause certain things to “pop out” at me.  Like today for instance.

Biotech Then…

OK, so what follows below eventually leads to my rhetorical question for the day.

If you were around the markets in 1998-2002 then you probably remember what happened to biotech stocks during this period.  If not – or if you have blotted it out, Figures 1 and 2 should refresh your memory.  Figure 1 shows the “blow off” in biotech stocks.1Figure 1 – Biotech stocks explode 1998-2000

From its low in September 1998, FBIOX advanced 379% in the next 18 months.  By March 6th, 2000 FBIOX was already up +74% for the year!  Of course, most investors are aware of what happened next. And it wasn’t pretty.  Over the next 28 months FBIOX lost a staggering -72%.2Figure 2 – Biotech stocks implode 2000-2002

And so we all look back at biotech in 1998-2002 as a classic example of a blow off top.

…and Now

So now let’s fast forward to today and take a glance at Figure 3….and then consider the rhetorical question emblazoned in red on Figure 3.3Figure 3 – FBIOX 2015

Just asking.

Summary

So am I suggesting that biotech is “blowing off” and that everyone should sell all biotech holdings and run like heck?  Not necessarily.  Remember this is just a rhetorical question based on a gut reaction to a picture.      And to be fair, you could probably have asked the same question a couple of months or even a couple of years ago. And biotech has simply continued to surge higher.

On a separate note, when I went outside yesterday to have the dog walk me, er, to walk the dog, there was a bunny rabbit sitting in the garden enjoying himself as he nibbled away.  When the rabbit saw me he became very alert.  He stopped chewing and focused all of his attention on me.  Note he didn’t run away immediately because there was no indication that I was a danger (except maybe to myself, but I digress).  But he was “poised for action” even as he stood there perfectly still.  The first hint of danger and no doubt he would have fled quickly.

When it comes to biotech, I sort of feel like that bunny.

Jay Kaeppel


Some Interesting (obviously not my own) Thoughts on Crude Oil Fundamentals

I tried to be a “Fundamentals Guy” a long time ago, I swear I tried.  I read everything about everything regarding the financial markets.  Then I would try to figure out what it all meant for future prices.  And after I figured it out I would enter a position and tell the markets what they were supposed to do.

Let’s just say that “the markets” didn’t much care about what I had decided they should do.  Hence the reason my trading evolved into a technical and seasonal approach.

Nevertheless, I still try not to be completely ignorant (I mean sure you get used to it after awhile but, well, never mind) regarding the factors that can move a given market.  As I wrote about here, when it comes to analyzing the fundamentals of various commodity related markets I like to follow James Cordier and Michael Gross of www.OptionSellers.com.

Here is their latest research on crude oil.  I found it to be interesting and I think you may too.

To see another (impressive) example of their analysis click here

To buy their book or learn more about it click here

To get all the information visit: www.OptionSellers.com

OK, here’s the weird part.  For the record I am not endorsing their service as I have never used it (although, also for the record – I have read their book cover to cover more than once).  I am merely highlighting a source of consistently very useful, interesting and enlightening information that I have enjoyed reading for many years.

Jay Kaeppel


Soybeans Begin Unfavorable Seasonal Period

As I wrote about here, soybeans have a tendency to display price weakness between July Trading Day #9 and August Trading Day #6.  This year’s period began at the close of trading on Tuesday, July 14 and extends through the close on August 10th.

See also An Update on Natural Gas Seasonally Unfavorable Period

As I wrote about in the linked article, beans have declined in price during this period in 30 of the past 37 years (81% of the time).  Does this mean that beans will decline this time around?  Absolutely not (in fact, on a purely anecdotal basis, my neighbor recently returned from Indiana and mentioned that he was surprised how little seemed to be growing in the fields along the expressway – typically driving through Illinois and parts of Indiana this time of year involves a mind-numbing and endless array of strongly growing crop fields – so, hey, you’ve been warned).

In the meantime, as you can see in Figure 1 – so far so good (bad? In this case bad being good) as November beans are down $0.14 (or $700 a contract) here on Day 1. 3Figure 1 – November Soybeans (down hard on Day 1 of seasonally unfavorable period) (Courtesy: www.BarCharts.com)

Time to take a profit?  You’ll have to decide that one on your own.

Jay Kaeppel


An Update on Natural Gas Seasonally Unfavorable Period

As I wrote about here and here, natural gas has showed a historical tendency to decline between June Trading Day #11 and July Trading Day #14 (6/15/15 through 7/21/15 this year).

As you can see in Figure 1, with one week left to go ETF ticker UNG and September Natural Gas futures are both slightly below their levels of 6/15, but has been advanced strongly in the last week, so things still hang very much in the balance.  The ETF ticker UNG and September Natural Gas futures both tried to break out to the upside on 7/14 but then reversed back to the downside.  As I write natural gas futures are once again trying to move to the upside however, in the early morning of 7/15.  So the bottom line is that the end result for this particular seasonal trend this time around remains hanging very much in the balance.1Figure 1 – Ticker UNG during “Unfavorable” Period so far (Courtesy: AIQ TradingExpert)

2

Figure 2 – September Natural Gas futures during “Unfavorable” Period so far (Courtesy: ProfitSource by HUBB)

From a trading perspective (and for what it is worth):

*I wrote about a potential option trade using options on UNG here

*And as I wrote here I would have taken the money and run on that option trade a short while back.  Yes, I understand that as the purveyor of this particular seasonal trend I should stick around to the bitter end and not take early profits and run away.

Sorry, it’s just my nature.

Jay Kaeppel

Beating the Market with Two Simple Cycles (Part 2)

In Part 1 I detailed the 40-Week Cycle and the 212-Week Cycle and spelled out specific rules for designating each of these cycles as “Bullish” or not.

For the 40-Week Cycle since 9/14/1962:

*The Dow gained +3,219% during “bullish” phases (+4,255 if 1% of annual interest is earned while out of the market)

*The Dow lost -12% during “non bullish” phases for the 40-Week Cycle

For the 212-Week Cycle since 7/24/1950:

*For all trading days for the Dow Industrials since 7/24/1950 the average daily % gain is +0.00031% (or +8% annualized).

*During the “bullish” phase of the 212-week cycle since 7/24/1950 the average daily % gain for the Dow Industrials is +0.00095% (or +27% annualized)

Now let’s look at market performance when we combine these two cycles.

Jay’s “Cycle System”

*If 40-Week Cycle is “Bullish”* then Cycle Model adds +1

*If 212-Week Cycle is “Bullish”** then Cycle Model adds +1

For any given day Cycle Model can read 0, +1 or +2

*40-Week Cycle starts a new bullish phase every 280 calendar days.  The next bullish phase starts at the close of 8/7/2015.  A bullish phase lasts 140 calendar days or until the Dow loses -12.5 on a closing basis from its price  at the lose of the cycle start date.

**212-Week Cycle starts a new bullish phase every 1484 calendar days (no, seriously) and the bullish phase last for 6 months.  the next 212-week bullish phase starts at the close of 7/27/2015.

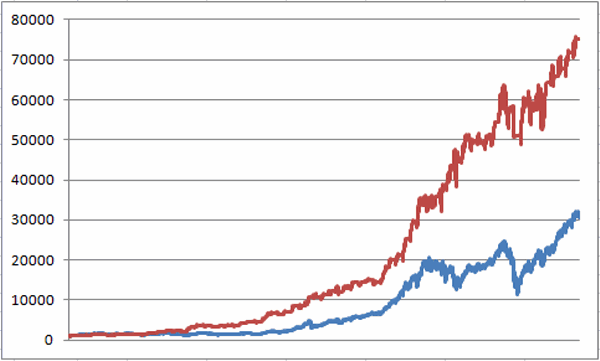
Figure 1 displays the growth of $1,000 invested in the Dow only when the Cycle Model = 0 from 10/1/62 through 7/10/15.4Figure 1 – Growth of $1,000 holding Dow Industrials only when Cycle Model is equal to 0 (10/1/62-7/10/15)

Now let’s look at the other extreme, i.e., when both cycles are bullish at the same time (i.e., when the Cycle Model is equal to +2).5Figure 2 – Growth of $1,000 holding Dow Industrials only when Cycle Model is equal to +2 (10/1/62-7/10/15)

Notice a difference between Figures 1 and 2?  (If not, may I suggest you consider a professional money manager to handle your affairs.)

Creating a Cycle Model System

So let’s take what we have so far and create an actual trading “system” with actual trading rules:

Rule #1. If the Cycle Model is greater than 0 (i.e., if EITHER the 40-week or 212-week cycles are “bullish” then hold the Dow Indutrials.

Rule #2. If the Cycle Model is equal to 0 then hold cash (this test assume 1% of interest per year).

The results for this “system” starting on 10/1/62 versus buy-and-hold appears in Figure 3.6Figure 6 – Growth of $1,000 holding Dow Industrials only when Cycle Model is equal to +1 or +2 (red line) versus Buy-and-Hold (blue line); (10/1/62-7/10/15)

 Results of Note (since 10/1/1962):

*Cycle Model = 0; Dow lost (-48%)

*Cycle Model > 0; Dow gained +5,833%

*If we add 1% of annual interest when out of the market, the Cycle System gained +7,426% versus +3,005% for buying-and-holding the Dow.

*The maximum drawdown for the Cycle System was -23.5%

*The maximum drawdown for buy-and-hold was -53.8%

Upcoming Cycle System Readings

*7/13/15 through 7/27/15 = 0

*7/27/15 through 8/7/15 = +1 (Bullish)

*8/7/15 through 12/24/15 = +2 (Bullish)

*12/24/15 through 1/27/16 = +1 (Bullish)

*after 1/27/16 = 0

Summary

As I am wont to say, the difference between +7,426% and -48% is what we “quantitative analyst” types refer to as “statistically significant.”  That being said, does it really make sense for investors to throw away all other forms of analysis and rely solely on two (OK, let’s jut go ahead and say it out loud – “somewhat arcane” – ) cycles to decide when to be in or out of the  stock market?  Probably not.

Still, it seems like a good time to invoke the school mantra from my alma mater, “The School of Whatever Works” – that being:

“Hey, whatever works.”

Jay Kaeppel


Beating the Market with Two Simple Cycles (Part 1)

If I were to say to you the following:

“The only thing that matters in the stock market is whether the 40-week cycle and/or the 212-week cycle is bullish”, chances are you would say either:

a) “Wow Jay, that’s very interesting analysis.  Have you considered taking some time off?”

OR, if you were in less of a convivial mood:

b) “That’s the dumbest thing I’ve ever heard in my life.”

Either response is understandable so no offense taken.   For the record, I am not actually stating that this theory is true.  I am just raising the issue.  Now let’s look at a few numbers to back up the theory.

The 40-Week Cycle

I have written about this cycle on several occasions (for example here and here) in the past.  For our purposes we will start our test at the close on 9/14/1962.  From that date forward:

*A new “bullish phase” begins exactly every 280 calendar days

*Each new “bullish phase” lasts exactly 140 calendar days and is followed by…

*…A new “non bullish phase” which also lasts 140 calendar days.

*For trading purposes a 12.5% stop loss is used (i.e., if the Dow Industrials closes 12.5% or more below its price at the start of a new bullish phase, the current bullish phase ends there.  This does not, however, alter the start date for the next bullish phase, which still occurs 280 calendar days after the start of the previous bullish phase).

*Also for trading purposes, we assume that 1% of annualized interest is earned while out of the stock market.

Sounds ridiculous, no?  Still as a proud graduate of The School of Whatever Works I submit to you Figures 1 and 2, which display the growth of $1,000 invested in the Dow only during “bullish” (Figure 1) versus “non bullish” phases since 1962.1Figure 1 – Growth of $1,000 holding Dow Industrials only when 40-week cycle is “Bullish”; in Cash earning 1% annually while out of the market (blue line) versus Buy-and-Hold (red line);  (9/14/62-7/10/15)

2Figure 2 – Growth of $1,000 holding Dow Industrials only when 40-week cycle is NOT “Bullish”; (9/14/62-7/10/15)

For the record:

*The System gained +4,255% holding the Dow during the “bullish phase” and cash during the “non bullish” phase.

*The Dow lost -12% during “non bullish” phases.

NOTE: The next 40-week cycle “bullish” phase begins at the close on 8/7/2015 and extends through the close on 12/24/2015.

The 212-Week Cycle

The 212-week cycle is something I learned from Peter Eliades, one of the pioneers of cyclical analysis and the Editor of Stock Market Cycles, way back in 1982.  Using a starting date of 7/24/1950:

*A new “bullish phase” begins exactly every 1484 calendar days later (212 weeks times 7 days a week).

*For my purposes, a new “bullish” phase last for exactly 6 months at which point the 212-week cycle is once again “neutral” – i.e., there is no “bearish” or “non bullish”, phases, only “bullish” or “neutral”.

Figure 2 displays the growth of $1,000 invested in the Dow Industrials only during the 6 months following each new cycle start date.3Figure 3 – Growth of $1,000 holding Dow Industrials only when 212-week cycle is “Bullish”; (7/24/50-7/10/15)

This “method” is only in the market 6 months every four year and four weeks, so is not meant to be a standalone strategy.  Still, for the record:

*The average daily % gain for all trading days for the Dow Industrials since 7/24/1950 is +0.00032% (or +8% annualized)

*The average daily % gain for the Dow Industrials during the “bullish” phase of the 212-week cycle since 7/24/1950 is +0.0095% (or +27% annualized)

NOTE: The next 212-week cycle “bullish” phase begins at the close on 7/27/2015 and extends through the close on 1/27/2016.

In Part 2 we will put the two cycles together and measure Dow performance.

In the meantime, try to remain calm…

Jay Kaeppel

Ominous Energy

There is a lot of Good News and Bad News in the energy stock sector these days.  To wit:

First the Bad News:

Between June 2014 and January 2015, energy stocks (using ETF ticker XLE as a proxy) suffered a roughly 30% decline.

See also A Mid-Summer’s Night(mare for) Beans

Then the Good News:

As you can see in Figure 1, XLE gave all the signs of a classic “bottoming out”, including:

1) A head-and-shoulders bottom formation and

2) A break above the neckline

3) A pullback and successful downside retest, followed by;

4) A breakout above a down trending trend line drawn during the previous decline.

So, #5) time to pop the champagne corks, pile into energy stocks and enjoy the new energy stock bull market, right?  Right?2Figure 1 – The “Classic” Bottom (or Not) in XLE

Then More Bad News:

Er, well, #6) as you can also see on the right hand side of Figure 1, the “classic” upside bull run lasted for about a month and about 8% from the point of the “classic” upside trend line breakout. Since then, XLE – oops – has fallen a little over 11% in a pretty straight line decline.

The (Potential) Good News:

Energy stocks are very oversold and are now near the support area created by the head-and-shoulders formation that formed in December and January.  So we could be setting up for an important bottom.  Um, or not.

The (Potential) Bad News:

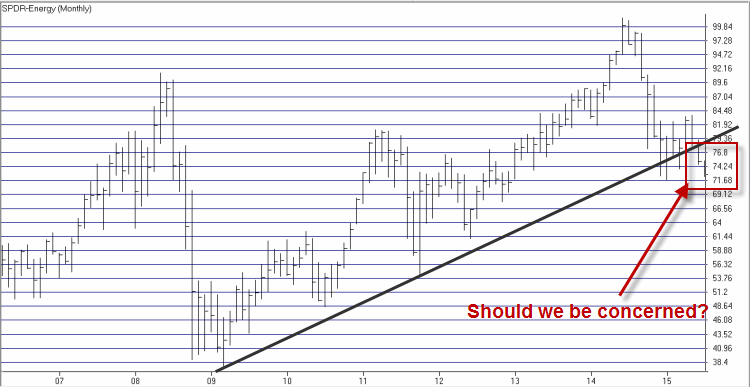
In Figure 2 we see that a fairly significant long-term upward trend line (if you’re into that sort of thing) was broken during the recent decline.  If you believe in chart patterns this is an ominous – and potentially significant – occurrence.1aFigure 2 – A potentially ominous trend line break for XLE

The Bottom Line

The price level of $71.70 for ticker XLE represents a critical support level.  If it holds we could have something of a “mega bottom” in place.  If it fails, the next meaningful support level for XLE is $67.77 and from there $61.11.

My advice: Grab an “energy” drink (har, good one) because you’ll want to stay awake on this one.  Keep a close eye on XLE in the days and weeks ahead for an important long-term clue.

Jay Kaeppel

A Mid-Summer’s Night(mare for) Beans

See also Ominous Energy

Grain prices have a long record of exhibiting seasonal price trends.  This is due primarily to the fact that the planting, growing and harvesting cycle in the Midwest remains the same year in and year out.

In a nutshell:

*Planting begins in early spring

*Growing takes place during the summer

*Harvesting occurs in the fall

*Repeat, ad infinitum, every year, ad nauseum, this year, next year, the year after that and so on and so forth…because it simply can’t be done any other way (at least not here in the Midwest where – trust me on this one – it gets really cold in the winter, and nothing can grow in the frozen ground).

This allows us to anticipate certain things on an annual basis:

*Prior to planting season there are exactly zero beans growing or even in the ground, thus there is “doubt” and “uncertainty” regarding the crop yield for the upcoming year.  At this point all we have are weathermen offering “predictions” regarding whether planting and growing season weather will be good or bad (and what could go wrong with following their advice?).  As a result, prices tend to rise late winter into early spring – especially during years with harsh winters.

*If there is trouble planting in the fields in spring we can anticipate a lower crop yield and thus higher prices (please do not make me explain the whole “supply and demand thing” again – that’s what God invented Google for) for beans.

*If there is a drought in the summertime – or too much rain – same thing…higher prices in anticipation of a lower crop yield.

*On the other hand, if planting and growing season experience good weather then we can anticipate that the crop yield will be abundant and as a result, bean prices will likely decline.

*In any event, usually by mid-summer the “bean counters” (no, seriously) have gone out into the fields and assessed state of the crops (and you think your job is boring) and are able to make a pretty good estimate (their job may be boring but they are pretty good at it) of whether the crop yield will be large or small.  Either way, once the “doubt” and “uncertainty” is pretty much removed, bean prices have showed a tendency to weaken during mid-summer.  This is true even during a bad year for growing beans as most of the “fear” buying already occurred during the winter into early summer months.

*By fall, the harvest is coming in – usually pretty much as projected months ago and nobody cares about soybeans for awhile and everyone loses interest until next year (come to think of it, it’s sort of like being a Cubs fan).  Thus bean prices tend to weaken in late summer to early fall.

So are there ways to take advantage of all of this boring repetitiveness?

Would I write an article and ask the question, if the answer was “No”?

Beans Bearish Seasonal Summer Bias

Soybean prices have showed a strong tendency to weaken between:

*The end of July Trading Day #9, and;

*The end of August Trading Day #6

Can I be any more specific than that?

This year this unfavorable period extends from the close on 7/14 through the close on 8/10.  Does this matter?  You be the judge.

The Historical Results

The following results were generated using November soybean data from July Trading Day 9 through August Trading Day 6. I manually checked the data from 2000 forward, prior year results are from “sources believed to be accurate.”  Here is what it shows:

*# of years showing a gain = 7 (18.9%)

*# of years showing a loss = 30 (81.1%)

*Average gain during 7 UP years = +3,234

*Average gain during 30 down years = (-$2,778)

*Average of all years = (-$1,640)

*Median of all years = ($-1,400)

*Largest gain = +$7,375 (1983)

*Largest Loss = (-$18,925) (2008)

Figure 1 displays the year-by-year results of holding a long 1-lot position in soybeans during the unfavorable July into August period from 1978 through 2014.

1Figure 1 – Annual $ change in 1-lot of soybean futures during unfavorable summer period (1978-2014)

Figure 2 displays the cumulative results of holding a long 1-lot position in soybeans during the unfavorable July into August period.

2

Figure 2 – Cumulative gain/loss holding long 1-lot of soybean futures during unfavorable summer period (1978-2014)

So the bottom line is that holding a long position in soybeans during this period is a whole lot like “swimming upstream”.  On the other hand, a speculator who plays the short side of the bean market during this period may find “the wind at his back.” (That being said, please note the use of the word “may” and the lack of the words “are” and “certain” and “to.”)

Summary

Are soybean prices sure to plummet between 7/14 and 8/10?  Hardly.  Remember that in 1983 beans gained over $7,000 a contract during this supposedly “bearish” period.  Also, it should be noted that 3 of the past 6 years have seen beans gain ground during this time.  So maybe this “cycle” has “run its course” and “lost its edge.”  In truth only time will tell.

The only things we do know for certain at the moment is that beans are non-existent in winter, are still planted in the spring, still grow in the summer and are still harvested in the fall.

Same as it ever was.

Jay Kaeppel


Settling for Silver

Apparently today is “Update Example Option Trade Day” here at JayOnTheMarkets.com. This article is an update of this previous article.

Trading Silver (using options on ETF ticker SLV)

In the initial article I highlighted the fact that as of mid-June the daily Elliott Wave count for ticker SLV (the ETF that tracks the price of silver) was bullish and that the weekly Elliott Wave count for Silver was bearish.  Based on nothing more than this (can you say “speculation”?) I highlighted a long straddle using August SLV options that might stand to make money if either of the Elliott Wave projections panned out.

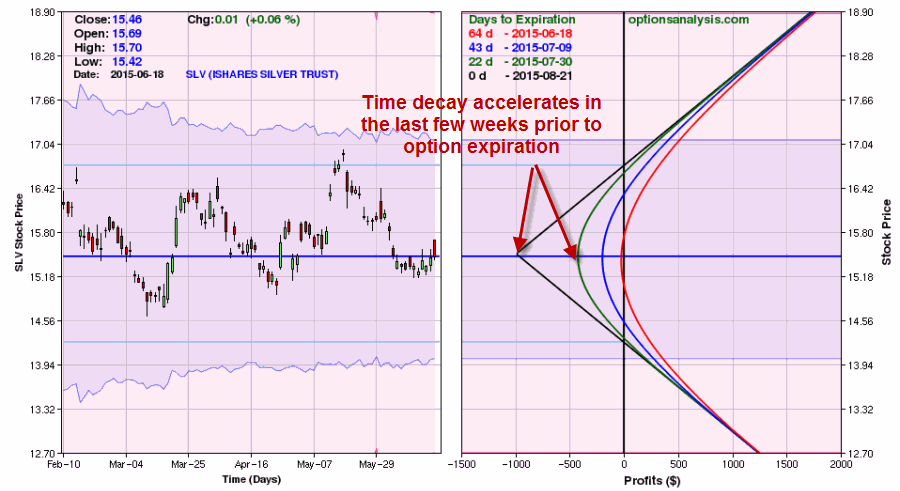
The initial risk graph at the time I wrote about this position initially appears in Figure 1.

34Figure 1 – Initial risk curves for August SLV straddle

The price for ticker SLV has subsequently broken to the downside.

The current risk curves for the August straddle appear in Figure 2.2Figure 2 – Risk curves for initial position as of close on 7/7/15

Key Things to Note:

*In general, there are two basic approaches to straddles:

Approach 1: Wait for a trend to develop (or a breakout) and then close the opposite leg and try to ride the winning leg as far as possible.

Approach 2: Set a profit target and if it is hit, sell immediately and take the money and run.

(A third approach involves entering a straddle prior to an earnings announcement and exiting shortly thereafter is another choice.  But that approach is a whole separate topic)

*Approach 1 is generally more of a longer-term strategy whereby a trader expects a breakout from a range or chart formation but is, a) not sure which way the breakout will go, and b) expects a decent move in price once the breakout does occur.

*Approach 2 is more of a “hit and run” strategy.

*The primary downside to Approach 1 is that not every breakout follows through in a meaningful way.  Therefore, you could enter a straddle, wait for the breakout, exit the losing leg, and then watch price reverse, creating a loss in the remaining leg.  Bottom line, you’d better have some reason to be pretty confident that a meaningful trend will follow the expected breakout.

*The primary downside to Approach 2 is a psychological one. Using Approach 2 you could sit with a straddle that is losing a little more money day after day (as time decay eats away at both options while price meanders) – which can drive a lot of traders crazy.  And then all of a sudden one day, there is a big price move, the trade hits the profit target and you are out.  While that doesn’t sound like (and is not) a bad thing, the reality is that this can be leave a lot of individuals “unsatisfied” as they never got to “ride a winner.”

In other words, people instinctively like to ride a winning trade for awhile because, well, let’s be honest, it feels good.  That does not happen if you trade straddles with a set profit target.  Either you are:

A) Losing, losing, losing, losing, losing and eventually close the trade with a loss, OR

B) Losing, losing, losing, losing, losing and then suddenly – BOOM – you are out of the trade with a profit, without the psychological gratification that comes with “riding a winner”.

For my own purposes I prefer Approach 2, but it took a long time to get there. As a trader who came to options from a futures trading background, I was “programmed” to “cut losses”.  So I would put on a straddle, watch it decay a little day after day, and finally I couldn’t take it anymore and “pulled the plug.”  I am sure you can guess what happened in many cases shortly after I got out (BOOM).

What to Do Now

For the record, this is a hypothetical trade intended as an example, so in reality there is nothing to actually “Do Now”.  In any event, in the initial article I suggested using the initial Elliott Wave price targets of 17.31 And 13.26 as areas to consider profit taking.  While this criteria is reasonable, typically for a long straddle I suggest setting a profit target of 15-20% of the amount paid to enter the trade and exiting the entire position when that level of profit it reached.

For this example trade:

*The cost to enter this particular SLV straddle was $992.  So a 20% profit target would be roughly $198.

*This level of profit would have been hit early in the day on 7/7/15 as SLV gapped down from a 7/6 close of $14.99 to $14.56 and then plunged all the way to $14.03.

*Note that price then rebounded and closed at $14.43, so a trader would have had to,

a) act quickly when the profit target level was reached, or,

b) already placed a good-till-cancelled limit order to exit the entire position if the profit level is reached (this means that the trader must do some homework initially and learn how to place unique orders such as this).3Figure 3 – SLV gaps down; 20% profit target hit, trade exited, Show’s Over, there’s nothing more to see here folks.…

Jay Kaeppel


An ‘Energetic’ Update #2

In a couple of recent articles (here and here) I wrote about natural gas and crude oil. Now seems like an exceptionally good time for an update.  In Update #1, I discussed natural gas.  Now let’s look at crude oil.

Crude Oil

In the initial article, I highlighted the fact that as of mid-May the daily and weekly Elliott Wave counts for crude oil were projecting sharply lower prices.  While I did not necessarily trust the magnitude of the projected price move, I made the argument that there is nothing wrong with a speculator “risking a couple of bucks” once in awhile.

So the example trade I detailed in the article involved trading put options on ticker USO, an ETF that ostensibly tracks the price of crude oil.  The trading in the original article was:

*Buying USO Aug 15 put @ $0.14

In the original article I listed a 10-lot, but just to make it interesting let’s assume that a trader was willing to commit $1,000 to the trade. In that case the trade could have bought 70 Aug 15 puts for a total risk of $980.

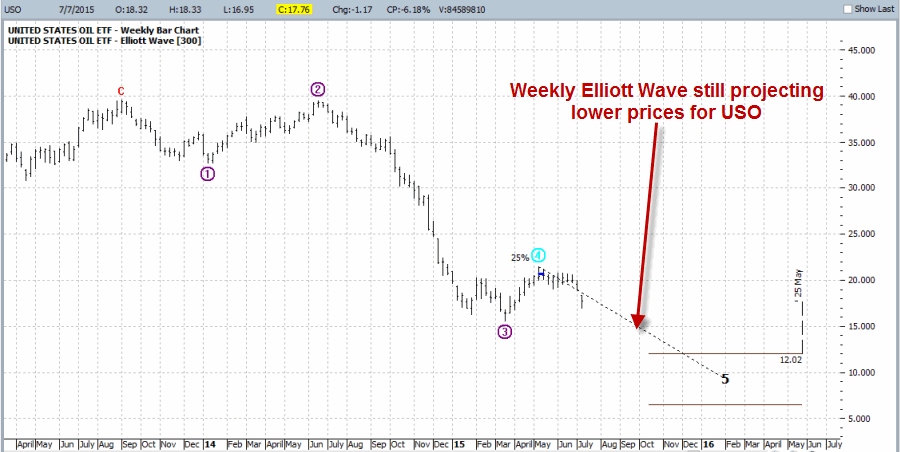
As you can see in Figure 1, USO has declined sharply and the Weekly Elliott Wave count is still projecting significantly lower prices (although for the record, the daily count is NOT).

1aFigure 1 – Weekly Elliott Wave count for ticker USO still pointing lower (Courtesy: www.ProfitSource.com)

On 7/6 USO closed at $17.73.  During the day on 7/7, USO traded as low as $16.95 – which created the opportunity to sell part of the position at a double – then rallied to close at $17.76.  As you can see in Figure 3 below, in the early plunge experienced by USO on 7/7, this option registered a “double” (i.e., hit a price of $0.28).

So let’s assume the following.  The trader:

1) Sold 40 of his original 70-lot at $0.28

2) Continues to hold the remaining 30-lot

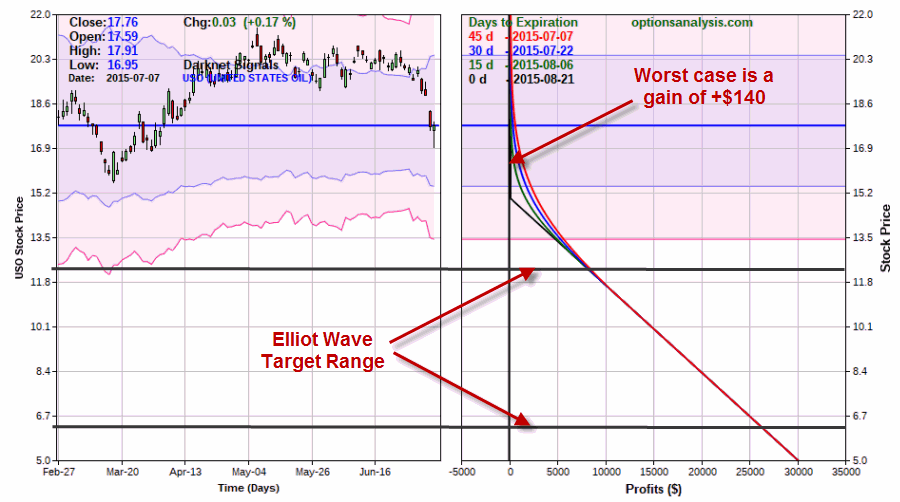
The current status of the trade appears in Figure 2 and 3.2aFigure 2 – USO Aug 15 puts  (Courtesy www.OptionsAnalysis.com)

3aFigure 3 – USO Aug 15 puts  (Courtesy www.OptionsAnalysis.com)

The current situation is this:

*The ProfitSource Weekly Elliott Wave count is projecting a target price of $12.02 to $6.50 for USO.

*The worst thing that can happen with this trade is that USO closes above $15 a share at August expiration, in which case this trade will have a profit of $140 (on a $980 investment).

*If by some chance USO does hit $12.02 a share prior to August option expiration this trade will show a profit in the $8,000 range.

OK, two important mitigating factors to consider:

1) The Weekly Elliott Wave count is projecting this price range to be hit sometime between October of 2015 and May of 2016, meanwhile;

2) We are holding an August put options

So is it realistic to expect to make $8,000 by August option expiration?  My own answer: Very highly unlikely. Still, we are now sitting with a “free position” with 45 days left until expiration.  Two choices at the moment are:

A) Let it ride for a while

B) Exit this position and roll out to a further out expiration month.

Summary

As I mentioned in the previous “Energetic” article, there are no right or wrong answers.  So the following is nothing more than one man’s position: the original purpose of the trade was simply to “take a shot” that crude would decline in price based on nothing more than daily and weekly Elliott Wave counts that were in bearish agreement.  To “roll out” now (i.e., to sell the August puts and buy puts in a further out expiration month would cost money and increase risk.  At this point I (personally) would be more inclined to let the current risk free August position “ride” for a little while.

As August expiration nears a trader can reassess things, but for now I would simply sit back and hope for the best (or in the case of crude oil, the worst) in the near future secure in the knowledge that this trade cannot lose money (thanks to selling 40 of the 70 put options purchased originally).

Jay Kaeppel