There is a lot of Good News and Bad News in the energy stock sector these days. To wit:
First the Bad News:
Between June 2014 and January 2015, energy stocks (using ETF ticker XLE as a proxy) suffered a roughly 30% decline.
See also A Mid-Summer’s Night(mare for) Beans
Then the Good News:
As you can see in Figure 1, XLE gave all the signs of a classic “bottoming out”, including:
1) A head-and-shoulders bottom formation and
2) A break above the neckline
3) A pullback and successful downside retest, followed by;
4) A breakout above a down trending trend line drawn during the previous decline.
So, #5) time to pop the champagne corks, pile into energy stocks and enjoy the new energy stock bull market, right? Right? Figure 1 – The “Classic” Bottom (or Not) in XLE
Then More Bad News:
Er, well, #6) as you can also see on the right hand side of Figure 1, the “classic” upside bull run lasted for about a month and about 8% from the point of the “classic” upside trend line breakout. Since then, XLE – oops – has fallen a little over 11% in a pretty straight line decline.
The (Potential) Good News:
Energy stocks are very oversold and are now near the support area created by the head-and-shoulders formation that formed in December and January. So we could be setting up for an important bottom. Um, or not.
The (Potential) Bad News:
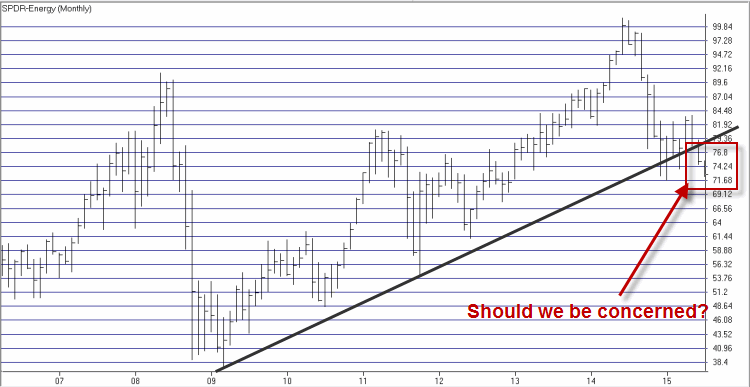
In Figure 2 we see that a fairly significant long-term upward trend line (if you’re into that sort of thing) was broken during the recent decline. If you believe in chart patterns this is an ominous – and potentially significant – occurrence. Figure 2 – A potentially ominous trend line break for XLE
The Bottom Line
The price level of $71.70 for ticker XLE represents a critical support level. If it holds we could have something of a “mega bottom” in place. If it fails, the next meaningful support level for XLE is $67.77 and from there $61.11.
My advice: Grab an “energy” drink (har, good one) because you’ll want to stay awake on this one. Keep a close eye on XLE in the days and weeks ahead for an important long-term clue.
Jay Kaeppel


Hi Jay,
I have been a lurker for years (AIQ for about 20 years) and have great respect for your opinion, I appreciate your observation. My charts indicate that we will see at least 69 before I expect to see confirming indications of an improving trend. I am looking at my AIQ WKLY XLE chart.
David