I have a pretty hard and fast rule about not being critical of other analyst’s work. The reality of the markets is that no one ever really knows for sure what will happen next. Sure some people get it right a lot more often than others (hence the reason some people get filthy rich in the markets and others do not). But at any given point in time, two people can disagree on the outlook for a given stock, sector, commodity, etc. and only time will tell who is right.
See also An Example Commodity Play in SLV
OK, with all of that as a preface I saw an article recently titled (something like) “Is Now the Time for Housing Stocks?” Truth be told I only read a small portion of the article but I think the gist of it was to suggest that now is a good time to buy housing stocks. And if so, the author may ultimately prove to be correct. But from my own analysis, I think I would have to answer the question posed in that article’s title as follows:
“Maybe, but Probably Not”
OK, granted that doesn’t exactly qualify as a “gutsy” call. But historically the summer into fall months have not been kind to stocks in general and especially not to housing stocks.
Housing Stocks by Month
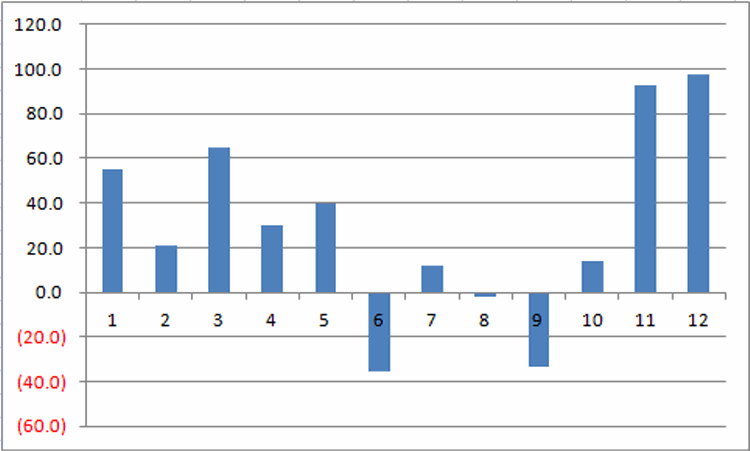
For our purposes we will us ticker FSHOX (Fidelity Select Construction & Housing Portfolio) as our proxy for housing stocks. Figure 1 displays the percentage gain or loss achieved by FSHOX by month starting on 9/30/1988. Figure 1 – % Gained or Lost by month (ticker FSHOX; 9/88 to present)
As you can see in Figure 1, June and September have seen net losses of roughly -35% and -34% respectively. July showed a modest net gain and August was basically a wash but with a small loss. The rest of the months showed a net gain.
So let’s sum it up this way:
*June through September = (-53.1%)
*October through May = +2,336%
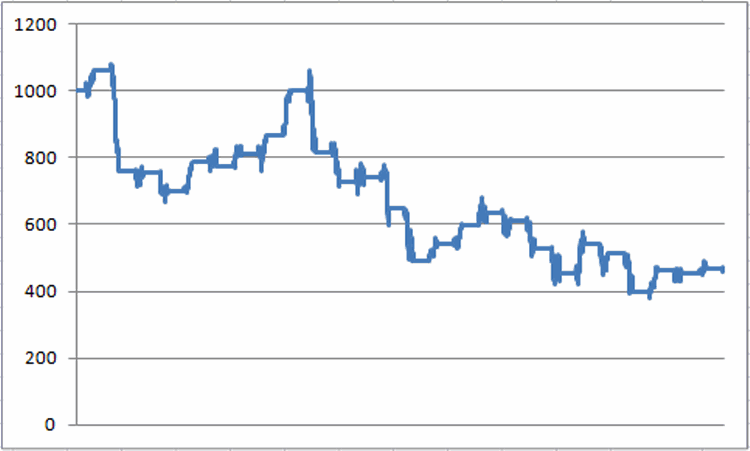
Figures 2 and 3 display the growth of equity during these two distinct bullish and bearish periods. Figure 2 – Growth of $1,000 holding FSHOX October through May (9/88-present)
 Figure 3 – Growth of $1,000 holding FSHOX June through September (9/88-present)
Clearly it is not as though housing stocks always rise between October and May, nor do they always decline between June and September. Likewise, the “bullish” period clearly suffered a significant drawdown in the 2006-2008 period. Still, even with that the net result was far superior to the “bearish” period results as displayed in Figure 3.
to put is as succinctly as possible, a gain of +2,336% versus a loss of -53.1% is what we “quantitative types” refer to as “statistically significant.”
Figure 4 displays the annual gain/loss for the “bullish” months versus the “bearish” months.
| Year | Nov-May | Jun-Oct |
| 1989 | 8.5 | 6.1 |
| 1990 | 24.2 | (28.3) |
| 1991 | 37.4 | (0.7) |
| 1992 | 28.7 | (7.5) |
| 1993 | 17.7 | 12.5 |
| 1994 | (16.9) | (1.7) |
| 1995 | 20.7 | 5.1 |
| 1996 | 1.2 | 6.4 |
| 1997 | (1.7) | 15.7 |
| 1998 | 50.9 | (18.5) |
| 1999 | (8.1) | (10.6) |
| 2000 | 5.5 | 1.7 |
| 2001 | 36.7 | (12.6) |
| 2002 | 21.0 | (24.1) |
| 2003 | 31.5 | 9.9 |
| 2004 | 16.9 | 10.1 |
| 2005 | 2.2 | 6.2 |
| 2006 | 5.4 | (3.2) |
| 2007 | (1.2) | (14.0) |
| 2008 | (18.1) | (13.6) |
| 2009 | 2.5 | 19.2 |
| 2010 | 27.8 | (5.3) |
| 2011 | 31.9 | (22.3) |
| 2012 | 18.2 | 15.6 |
| 2013 | 23.4 | (1.4) |
| 2014 | 12.8 | 2.9 |
| Average | 14.6 | (2.0) |
Figure 4 – Annual Results for FSHOX (bullish periods versus bearish periods)
A few things to note appear in Figure 5:
| Measure | Bullish Period | Bearish Period |
| Annual % +(-) | +14.6% | (-2.0%) |
| #(%) Times Up | 21 (80.5%) | 12 (+46.2%) |
| #(%) Times Down | 5 (19.5%) | 14 (+53.8%) |
| Outperformed other period | 20 (76.9%) | 6 (23.1%) |
Figure 5 – Comparative Results – Bullish Periods versus Bearish Periods for Housing stocks
Summary
It is important to note that none of the data presented in this article precludes the possibility that housing stocks will advance between now and the end of October this year. Still if the question posed is “is now the time to buy housing stocks”, history suggests that the proper answer is:
“Maybe, but Probably Not”
So as a “Rule of Thumb”:
*Buy a house in the summer? OK
*Sell a house in the summer? OK
*Buy housing stocks in the summer? Maybe not so much
Jay Kaeppel

