Yes it’s May and that is an exciting time for us financial writer types as we stumble over one another in our haste to post our obligatory “Sell in May and Go Away” related articles. As you can see, at #2,106 (for the record just sort of a ballpark guess – but probably pretty close to correct) I am a little late to the game (I knew I shouldn’t have gone away this weekend).
Anyway, given all the annual hubbub regarding selling in May and going away, it sort of makes me wish I had something really useful to offer. Anyway, let’s start by noting that in terms of the four-year presidential election cycle, 2015 is a “pre-election” year. This is significant because the pre-election year has by far been the best overall performer of the four years in the cycle (post-election, mid-term, pre-election and election years). Figure 1 displays the growth of $1,000 invested in the Dow only during pre-election years since 1933.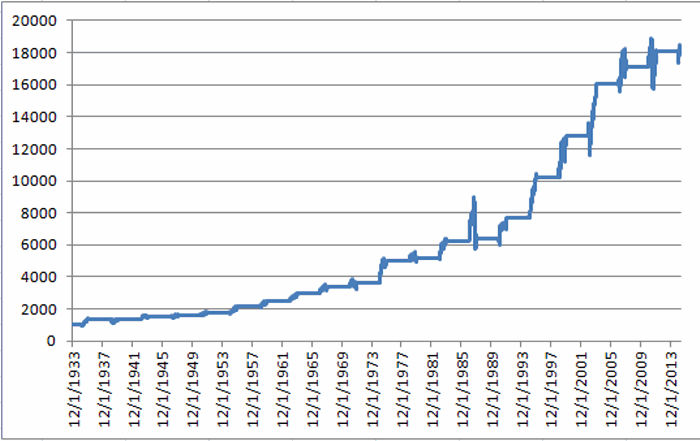 Figure 1 – Growth of $1,000 invested in Dow Industrials only during pre-election years
Regarding “Sell in May”, I start the annual “seasonally unfavorable” period after the close of the third trading day of May and extending through the close of the last trading day of October. The remainder of the year, i.e.,:
*From December 31st of the mid-term election year and the 3rd trading day of May and;
*from the close on October 31st of the pre-election year through the close of December 31st of the pre-election year.
…is considered the “seasonally favorable period”
Figure 2 displays the “seasonally favorable” and “seasonally unfavorably” periods broken out separately. 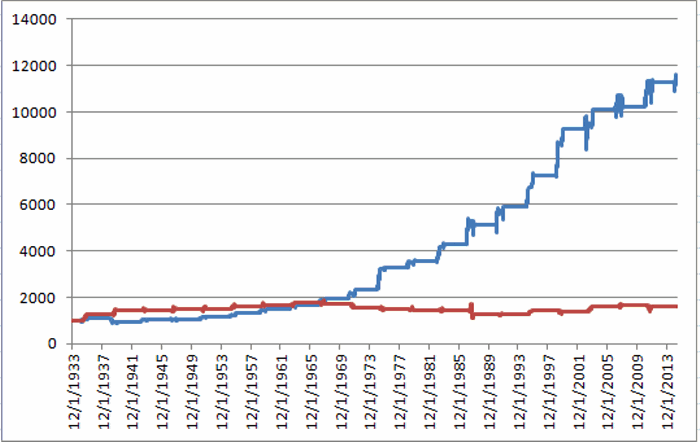 Figure 2 – Growth of $1,000 invested in the Dow during seasonally “favorable” and “unfavorable” periods during pre-election years
From quick glance at Figure 2, a trader can clearly see that the “favorable” period has far outperformed the “unfavorable” period. So one might conclude that “selling in May” is a good idea during pre-election years. But in reality, that is not necessarily the case.
Close look at Figure 3 revels that there have been plenty of occasions when the Dow showed a gain during the so called “unfavorable” period within pre-election years.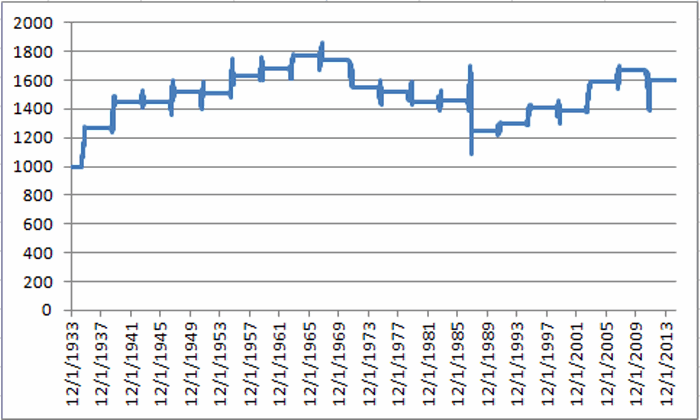 Figure 3 – Growth of $1,000 invested in Dow Industrials only during “unfavorable” periods (i.e., May trading day 3 through end of October) during pre-election years
This is confirmed by the numbers that appear in Figure 4.
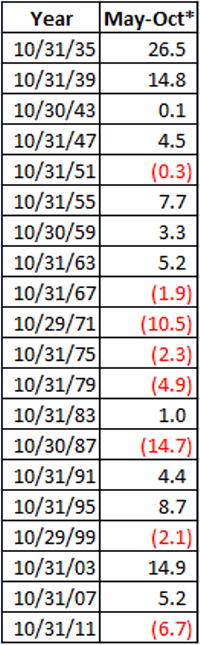
Figure 4 – Dow %+(-) during “unfavorable” periods within pre-election years
** – “Unfavorable period extends from end of 3rd trading day of May through the end of October
As you can see, the “unfavorable” period during pre-election years:
*Up 12 times
*Down 8 times
*Average UP = +8.0%
*Average DOWN = -5.4%
*Largest UP = +26.5% (1935)
*Largest DOWN = (-14.7) (1987)
Summary
So what does it all mean. I think it means three things:
A) Selling in May is not “automatic” this year
B) Keeping an eye on the trend is very important between now and the end of October is very important
C) You can probably skip the next 2,106 “Sell in May” articles you come across.
Jay Kaeppel


Have you looked at breaking out the day session performance from the overnight performance?
Ryan
daxgaptrading.wordpress.com
Perfect seasonal trade
Equally weighted FBIOX FSESX FSENX FSRPX FSRFX FSCGX FSELX FSCHX Jan thru May, and Dec
Equally weighted FBIOX FDFAX June thru Nov
Beats VFINX 27 of the 29 years 1987-2015 CAGR 20%
1987 11.71%
1988 22.02%
1989 41.87%
1990 24.72%
1991 52.72%
1992 14.74%
1993 26.20%
1994 3.91%
1995 36.01%
1996 18.74%
1997 22.57%
1998 24.07%
1999 43.93%
2000 41.82%
2001 9.54%
2002 -10.31%
2003 23.33%
2004 6.28%
2005 8.22%
2006 17.00%
2007 25.45%
2008 -4.73%
2009 40.09%
2010 17.02%
2011 13.81%
2012 17.57%
2013 31.27%
2014 24.54%
2015 2.99%
Sorry, FBIOX FDFAX VUSTX June thru Nov
Missed VUSTX