A while back I wrote two articles that ultimately culminated in an indicator that I call (clearly for the lack of a better name) “RSI Everything”)
This time out let’s look at a simple method to use this indicator using weekly bar charts. As always this information is “food for thought” and not “an automated system guaranteed to generate profits beyond the Dreams of Avarice” (although for the record I am still working on it).
It might serve as “a good place to look” for trading ideas for “Weekend Warriors”, i.e., those who don’t have a lot of time to follow the markets during the week so do most of their analysis over the weekend.
Notes
*The AIQ TradingExpert Design Studio code is posted in the articles linked above. It can be easily adapted to other trading software (at least by trading system code junkies that are into that kind of thing – “Hi, my name is Jay”).
*This method is probably best used with sector ETFs and index ETFs rather than with individual stocks – but traders are encouraged to experiment.
The Setup
At the end of the current week:
- The 5-week simple moving average is above the 55-week exponential moving average.
- RSI Everything registers a weekly close of -32 or below.
The Trigger
- Buy shares or the ETF (or stock) in question when it hits the previous week’s high price plus $0.02 per share.
The Exit
- Close the trade at a profit on the first profitable weekly close.
- Close the trade at a loss if price falls $0.02 or more below the previous week’s two week low.
- Close the trade – whether at a profit or a loss – if the 5-week simple moving average closes below the 55-week exponential moving average.
More Notes
*A trader might also consider using a hard percentage of trading capital stop to cut a loss rather than waiting for the two week low to be hit.
*It may take a few weeks after the initial setup before price actually triggers an entry signal by taking out the previous week’s high.
Example
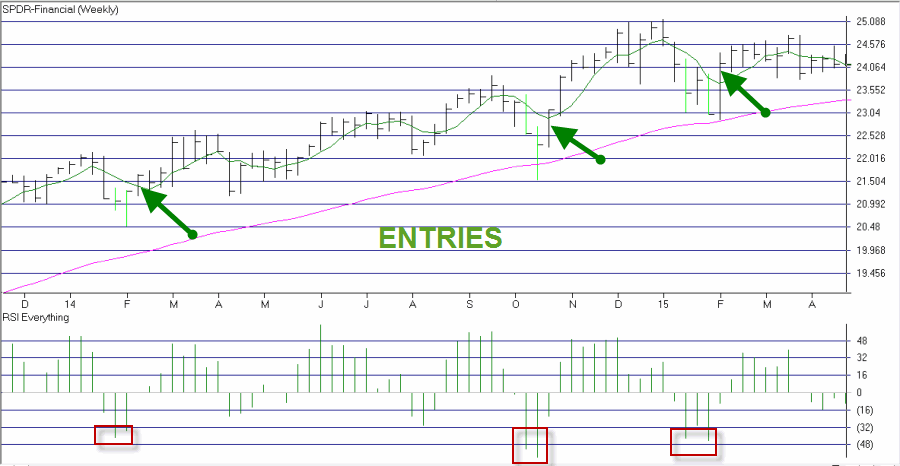
Figures 1 through 4 highlighted this method using ticker XLF Figure 1 – Ticker XLF with Indicators (Courtesy: AIQ TradingExpert)
 Figure 2 – Ticker XLF with Setups (Courtesy: AIQ TradingExpert)
 Figure 3 – Ticker XLF with Entries (Courtesy: AIQ TradingExpert)
 Figure 4 – Ticker XLF with Exits (Courtesy: AIQ TradingExpert)
Even More Notes
There is nothing magic about:
*5-day simply and 55-day exponential moving averages;
*Previous week’s close +$0.03
*First profitable weekly close
*Two-week low – $0.02
So industrious traders are encouraged to experiment.
Also, traders may also consider trading call options as a potential low cost alternative to buying ETF shares. If you choose to go this route consider using www.OptionsAnalysis.com.
Summary
As always, remember that this is “an idea” and not “a system.” In the end, the method described herein is simply another entry in the well established approach of “buying after a pullback.”
Same as it every was……um, but different…..sort of.
Jay Kaeppel


For those of us not using AIQ, is it possible to replicate your RSI Everything
using StockCharts.com? What RSI parameters would come closest? Thanks.
Jim, anything can allows you to create custom indicators can be used. RSI Everything is nothing more than a compilation of four separate “RSI like” indicators, each with a slightly different way of using RSI to come up with a value. I am going to post a separate article with just the indicator calculations shortly. Basically the first three use he standard 2-day, 3-day, 4-day and 14-day RSI in some way or another. At some point, 50 is subtracted from the value to create an indicator that uses 0 as a neutral reading rather than 50. TDREI is Tom Demark’s Range Expansion Index and involves a fair number of calculations, but still not all that complex. RSI Everything is just the average of the four.
Two notes: RSI Everything was created because I couldn’t figure out which of the four was “best” – so basically just threw them together to create one “everything and the kitchen sink” RSI based indicator. Second, the concept of buying on pullbacks – even on a weekly chart – can be implemented with virtually any decent overbought/oversold indicator. You just have to have enough confidence in the signals to act. Jay
Thank you, Jay for RSI everything. It means everything to me.
Steve, Good one, Jay