A while back I wrote about some “VIX-like” indicators that can be applied to stocks, ETF, futures, etc. Well, today let’s add one more to the mix. This one – which for (clear) lack of a better name –I refer to as VixRSI14x (Note to myself: you really have to come up with a better way of naming these things).
It combines a “vix-like” indicator with the standard 14-day RSI. Also, whereas VIX moves higher as price declines, I flip this one on its head to create negative indicator readings align with price declines and oversold conditions.
The Calculations
A word of warning: if indicator calculations make your head hurt you might want to skip this section and go down to the charts below. The VIXRSI14x indicator combines the standard 14-day Welles Wilder RSI with Larry Williams VixFix indicator as follows.
A = Highest close in last 22 trading days
B = A – today’s low
C = (((B – A) / A) * 100) + 50
VixFix = C
The 14-day RSI is calculated using the standard Wilder RSI formula found in most charting programs (AIQ TradingExpert code is found below)
VixRSI14 is calculated as follows:
D = 3-day exponential average of Daily VixFix readings
E = 3-day exponential average of daily 14-day RSI readings
F =D/E
VixRSI14 = F
This indicator as designed will typically rise in value as prices decline. In order to create an overbought/.oversold indicator that moves in line with price, the value is inverted as follows:
VixRSI14x = ((1/VixRSI14)*100)-100.
(Hey I warned you to skip ahead to the charts)
The following is code or AIQ TradingExpert Design Studio:
!VixFix calculations
hivalclose is hival([close],22).
vixfix is (((hivalclose-[low])/hivalclose)*100)+50.
!14-day Rsi calculations
Define days14 27.
U14 is [close]-val([close],1).
D14 is val([close],1)-[close].
AvgU14 is ExpAvg(iff(U14>0,U14,0),days14).
AvgD14 is ExpAvg(iff(D14>=0,D14,0),days14).
RSI14 is 100-(100/(1+(AvgU14/AvgD14))).
VixRSI14 is expavg(vixfix,3)/expavg(RSI14,3).
VixRSI14x is ((1/VixRSI14)*100)-100.
The Resulting Indicator
Now I would like to claim that VixRSI14x is a highly accurate timing tool that picks tops and bottoms with uncanny accuracy. And the truth is, at times it sorta does. On the other side of the coin one could probably make an argument that this is just one more “Overbought/Oversold” indicator. I will leave the more industrious to draw their own conclusions.
A few “suggestions” for highlighting potential bullish opportunities:
1) Consider looking for situations when SPY is oversold or bouncing off of a low as a catalyst to look for buy signals among the stocks and/or ETFs you follow (One possibility is to look for VixRSI14x to drop below -16 and then turn up).
2) When looking at individual stocks and ETFs look for upside reversals from -32 or below.
3) Look for signals on stocks/ETF that are above their 200-day moving averages.
4) Consider taking profits on the first good “pop” and letting the rest ride.
A Few Charts
On 2/2/15 the VixRSI14x indicator for ticker SPY reversed to the upside after dropping below-16. See Figure 1.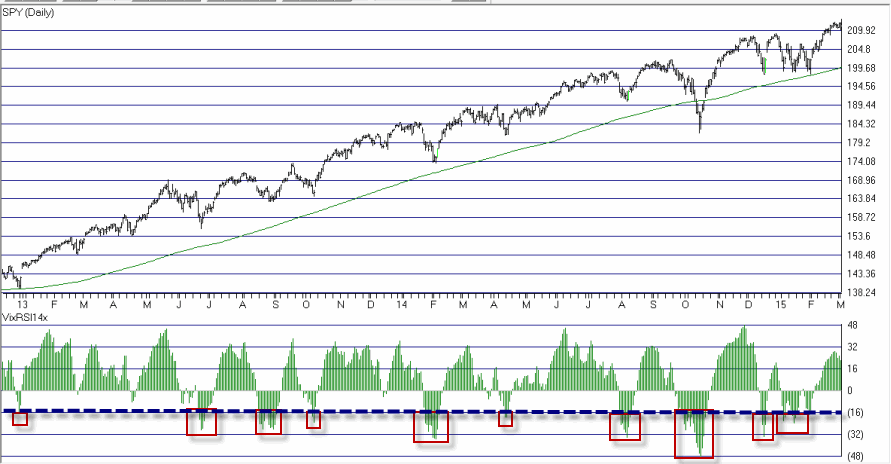 Figure 1 – SPY with -16 or lower oversold VixRSI14x signals (Courtesy: AIQ TradingExpert)
A sampling of stocks that met the criteria listed above on 2/2/15 appears in Figures 2 through 5 below.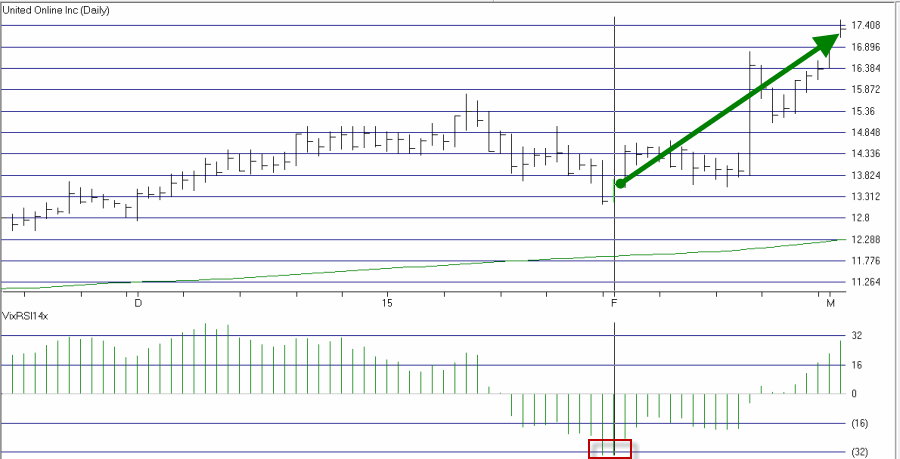 Figure 2 – Ticker UNTD (Courtesy: AIQ TradingExpert)
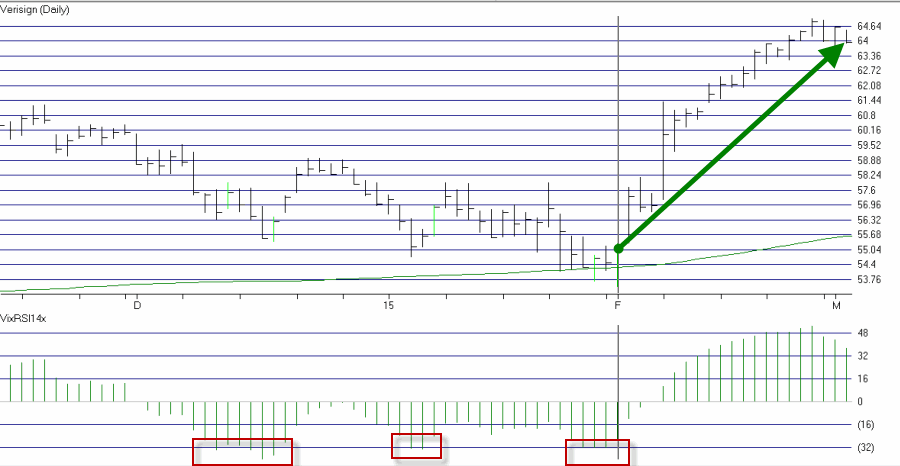 Figure 3 – Ticker VRSN (Courtesy: AIQ TradingExpert)
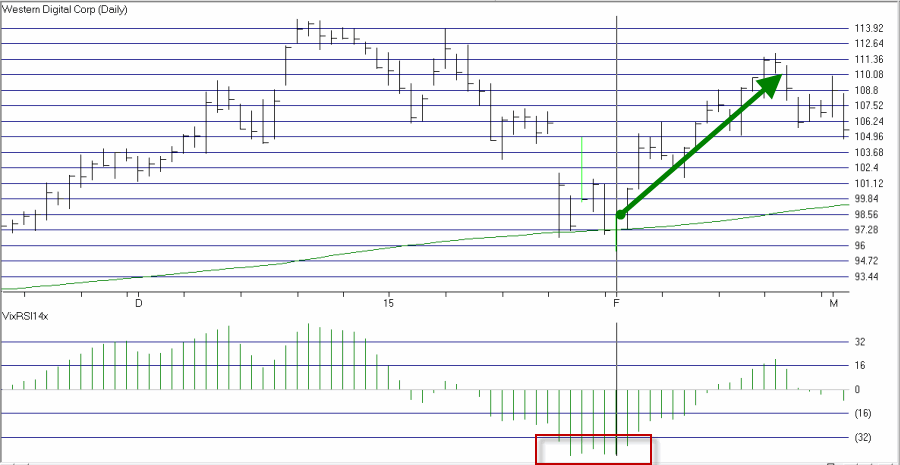 Figure 4 – Ticker WDC (Courtesy: AIQ TradingExpert)
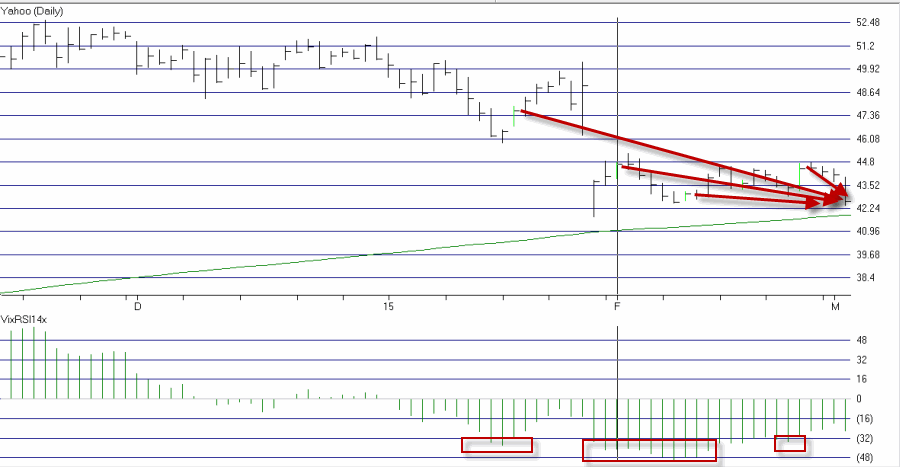 Figure 5 – Ticker YHOO; no upside follow through from multiple signals (Courtesy: AIQ TradingExpert)
Some of these experienced an immediate “pop”, while others – most notably YHOO – have gone nowhere. This is fairly typical. As with most things in trading, some signals work while others do not. As with any kind of oversold indicator there is never any guarantee that every signal for every stock will be followed by rainbows and unicorns. This suggests that industrious traders might consider looking for some sort of “confirming” indicator to highlight trades that they believe have the best potential for moving higher.
Summary
So is “VixRSI14x” the “next big thing”, or simply just another oscillator that rises when price rises and falls when price falls? My experience suggest that it is “someplace in between.”
My experience also suggests that that is not necessarily a bad place to be.
Jay Kaeppel


Hey Jay! Was just looking over the examples you gave. Two of those four experienced positive earnings beats shortly after the signal (UNTD and VRSN). So it might not be a fair assessment of the indicator. Have you looked over a wider sampling of data? Hey don’t get me wrong, I love to dig into some good indicator code (and have coded your earlier VixFix and MCVI indicators). Just thinking the examples might not be the ideal candidates.
BTW I took the MCVI, tweaked it for individual stocks, and came up with a system that looks pretty good.
Yes, for the record these four examples are completely anecdotal- although on that particular day 3 out of about every 4 looked pretty good.