Typically, I don’t like to rain on other people’s parades – you know, karma being what it is and all. And when it comes to analyzing the financial markets and trading, I am a proud graduate of “The School of Whatever Works.” So if someone tells me that the key to their success comes from analyzing the ratio between the VIX Index and the price of arugula, I say “more power to ‘em.” (OK, this is a made up example. Please DO NOT email me and ask me if I have back data for the price of arugula. I do not. At least not that I am aware of. Maybe I do. I should look. Wait, no!).
So anyway, what follows is not meant to denigrate anybody else’s analysis. But one thing that has always bugged me is when people arbitrarily draw all kinds of things on a price bar chart and then say “Aha!” One notorious example is a guy I used to know who was a big believer in Gann and Fibonacci (not that there is anything wrong with that). So if we were to talk (assuming we were still talking) about the gold market he might send me a chart that sort of resembles the one that appears in Figure 1. This is a weekly bar chart for ticker GLD – an ETF that tracks the price of gold bullion – with a Gann fan and Fibonacci Retracement lines drawn. 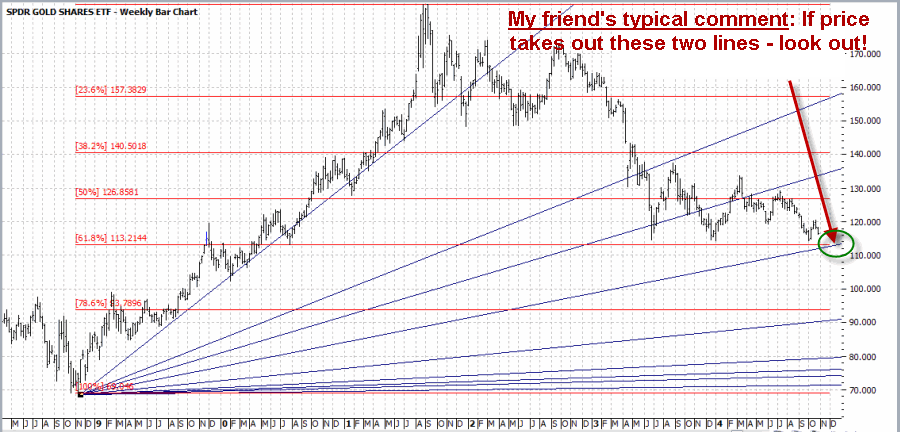 Figure 1 – Ticker GLD with a Gann Fan and Fibonacci Retracements (Courtesy: ProfitSource by HUBB)
As you can see in Figure 1 there is in fact a point where the 61.8% “Fib line” (as we “professional market analysts” like to refer to them) will intersect with the, well, one of the Gann Fan lines. Is this actually significant in any way? [Insert your answer here]. But I would likely respond to him by saying something constructive like, “Interesting analysis. Hey what about the other 50 lines you’ve drawn on this chart?” To which he would likely respond by saying something equally constructive like “$%^ you.” (You kind of get the idea why we don’t talk much anymore).
For the record please note that at no time did I denigrate his analysis (well, maybe in a sneaky, snarky sort of way – sorry, it’s just my nature). But if it works for him, that’s great. But seriously, what about the other 50 lines? And please remember that for the sake of clarity I did not include the 4 to 6 “key” moving averages that he would normally include on a typical bar chart. Anyway, in the end it seems like an appropriate time to invoke:
Jay’s Trading Maxim #102: If you draw enough lines on a bar chart, price will eventually touch one. This may or may not signify diddly squat.
or the addendum:
Jay’s Trading Maxim #102a: The market may not care that you’ve drawn a particular line on a particular chart. Just saying.
So with this in mind, let’s turn to the price of gold and Elliott Wave Analysis.
Gold and the Elliott Wave
I always feel compelled to point out that I am not now, nor have I ever been a true “Elliotthead.” But I know enough traders whom I respect who are serious users of Elliott Wave analysis that I do try to pay attention. So let’s take a look at a recent example, in this case using the ticker GLD.
The biggest problem I always had with Elliott Wave is figure out when one wave is – um, waving goodbye and another wave is about to crest. So I rely on ProfitSouce from HUBB to do the work for me. In Figure 2 you see a bar chart for ticker GLD with ProfitSource’s version of the latest Elliott Wave count drawn. As you can see in Figure 2, the indicated wave count just crossed down into a bearish Wave 5 (although most of the people I know who follow Elliott Wave refer to this as a “Wave 4 Sell”. Go figure).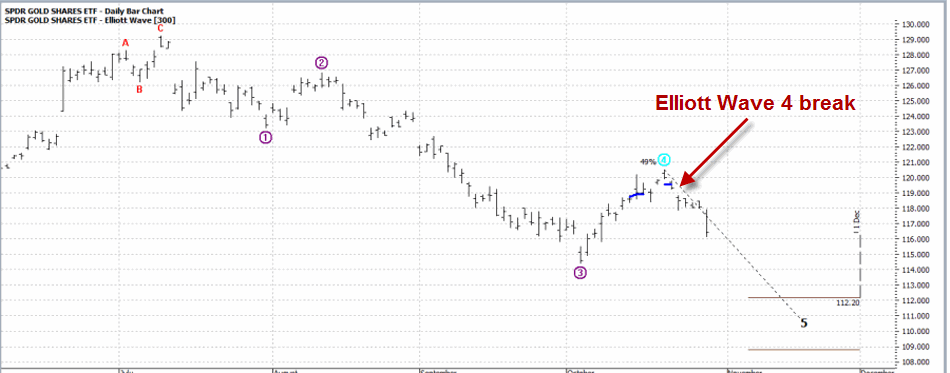 Figure 2 – GLD and Elliott Wave w/Wave 4 Sell signal (Courtesy: ProfitSource by HUBB)
So let’s assume that a person wanted to play the short sort of gold based on this one signal (for now we will ignore the question of whether or not this is wise). One avenue would be to sell short 100 shares of GLD at $119.34. This transaction would involve putting up margin money of roughly $6,000 and assuming unlimited risk to the upside (Remember that if you sell short shares of GLD and gold decides for some reason to open $20 higher tomorrow your stop-loss to buy back your short GLD shares at $125 is not necessarily going to limit your risk).
My preferred play would be to use put options on ticker GLD. Of course, with options there is always “more than one way to play.” So let’s look at two.
Strategy #1: The “I Want to be Short Gold” Strategy (Buy a Deep-in-the-Money Put)
The objective with this strategy is to get as close to point-for-point movement with the underlying security (i.e., shares of GLD) as possible, at a fraction of the cost. In this example, the trade in Figures 3 and 4 involves buying the December 127 put at $8.40.  Figure 3 – Buying Deep-in-the-money GLD Put (Source: www.OptionsAnalysis.com)
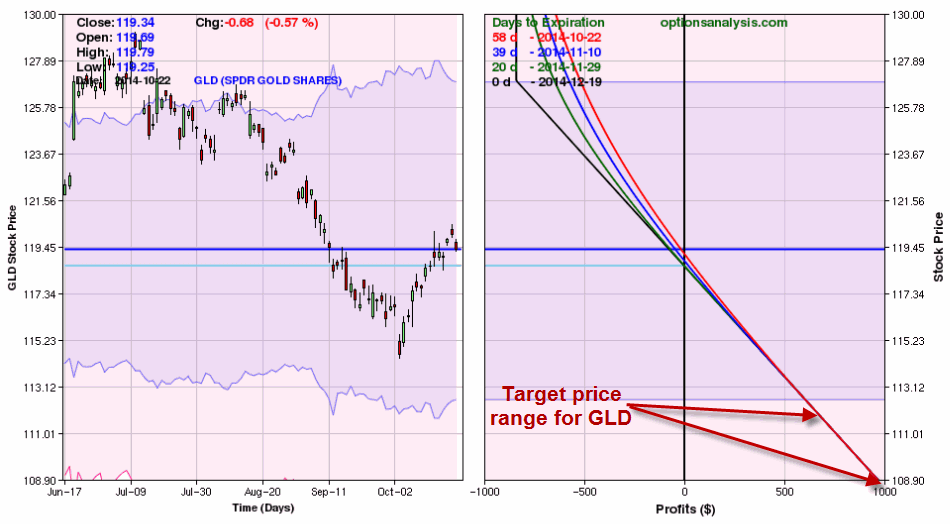 Figure 4 – Buying Deep-in-the-money GLD Put (Source: www.OptionsAnalysis.com)
This trade costs $840 – which represents the maximum risk on the trade and has a delta of -79.77. This means that this trade will act roughly the same as if you had sold short 80 shares of ticker GLD (which would entail putting up margin money of roughly $4,800 and the assumption of unlimited risk.
If GLD falls to the upper price target range indicated in Figure 2 (112.20) this trade will generate a profit of roughly $700. As this is written, GLD has fallen from 119.34 to 115.76 a share and the December 127 put is up from $8.40 to $11.40 (+36%).
Strategy #2: The “I’m Willing to Risk a Couple of Bucks in Case the Bottom Drops Out of Gold” Strategy (buy an OTM Put Butterfly)
This strategy is for people who are willing to speculate and risk a few dollars here in there in hopes of a big payoff. Now that phraseology probably turns a few people off, but risking a few bucks in hopes of a big payoff is essentially the definition of intelligent speculation.
So for this I turn to www.OptionsAnalysis.com which helpfully has an OTM Butterfly Finder routine built in.
This trade involves:
Buying 1 December 118 put
Selling 2 December 108 puts
Buying 1 December 98 put
The cost of this trade is only $170. 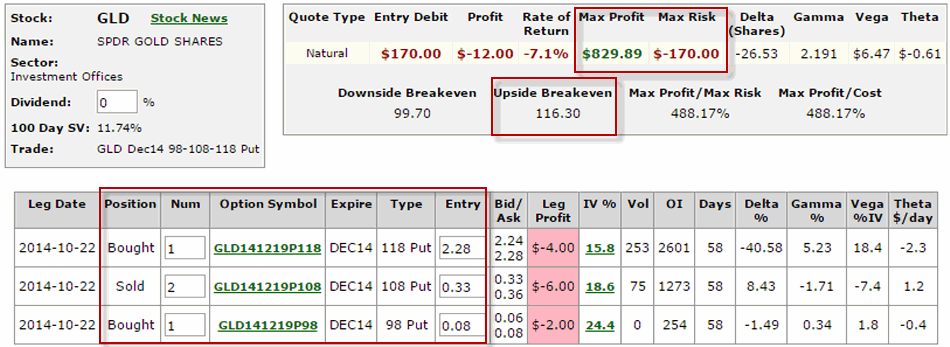 Figure 5 – Buying OTM Butterfly spread in GLD (Source: www.OptionsAnalysis.com)
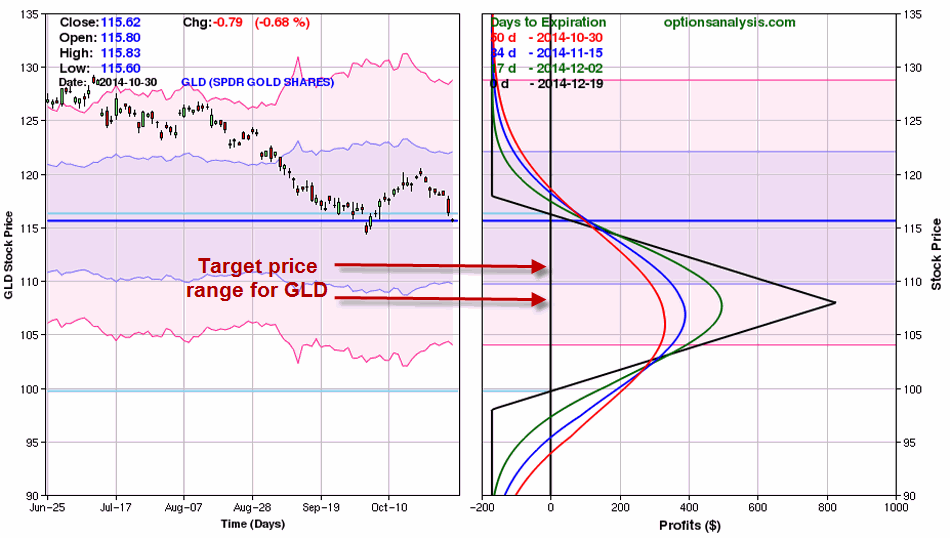 Figure 6 – Buying OTM Butterfly spread in GLD (Source: www.OptionsAnalysis.com)
As you can see, if GLD does fall into the price range projected by the Elliott Wave count shown in Figure 2, this trade can make anywhere from $250 to $700 or more based on $170 of risk.
As I write, GLD is trading at $115.76 and this open position shows a profit of $94 (+55%).
Summary
There sure are a lot of ways to analyze and play the financial markets. As a proud graduate of “The School of Whatever Works” (our school motto is “Whatever!”) I am not here to tell you what tools you should use (nor how many lines you should draw on a bar chart) or what type of trading strategies you should use to act on any particular trading strategies. My only purpose in this blog is to provide food for thought.
Whether or not a single particular Elliott Wave count constitutes a valid trading signal is up to each trader to decide. But whatever the indicator, once a signal to play the short side is given, more choices arise. In this example, three choices are to:
1) Sell short shares of GLD (putting up margin money and assuming significant risk),
2) Buy an in-the-money put option to track the price of GLD without as much cost and with limited risk
3) Risk less than $200 to gain exposure to the downside in GLD
Food for thought. Feel free to “chew on that” for awhile.
Jay Kaeppel

