In my last article (http://tinyurl.com/mzhstm2) I wrote about a simple entry method I have dubbed “The RSI 3 Strikes and You’re Out Play” or TSYO, for short.
The RSI 3 Strikes and You’re Out Method is a good candidate for option traders as it offers the potential to “make a few bucks” when the market experiences a pullback. So this week I want to offer a few examples.
In the interest of full disclosure I had planned to do it last week, but once my family and I arrived in Aruba I quickly settled into the “Sleep Late, Run on the Beach, Lay on the Beach, Swim in the Ocean and the Pool, Shower, Go to Dinner, Repeat” routine. And in the midst of that “busy” schedule I found little time to write.
TSYO Examples
I have a list of stocks and ETFs that I follow for option trading purposes. Not necessarily the “definitive” list but a good mix of tickers that trade lots of option volume. The list in Figure 1 displays some recent TSYO signals for some of the stocks on my list.
*The first column shows the stock ticker.
*The second column shows the date of the “Alert” signal (i.e., the 2nd non confirmation by RSI).
*The third column shows the date that the stock or ETF takes out the low of the previous three days.
|
Ticker |
Alert |
3-Day Low |
|
AMGN |
7/3 |
7/8 |
|
AMZN |
7/22 |
7/25 |
|
EEM |
7/28 |
7/30 |
|
F |
7/24 |
7/25 |
|
GM |
7/3 |
7/17 |
|
IBM |
7/18 |
7/21 |
|
IBM |
7/24 |
7/30 |
|
IWM |
7/1 |
7/7 |
|
JPM |
7/28 |
7/29 |
|
SLV |
7/2 |
7/7 |
|
SMH |
7/22 |
7/24 |
|
TXN |
7/11 |
7/17 |
Figure 1 – TSYO Alerts and Triggers
For the purposes of this article we will assume that a put option is bought at the close of the “3-Day Low” day. For deciding which put option to buy we will use the “Percent to Double” routine found at www.Optionsanlysis.com.
One note, while I will highlight the profit potential for each trade reviewed, I will not detail any specific “exit criteria”. My goal is to highlight the entry signal and not necessarily create a mechanical “system”. I also think that each trader should do some thinking and consider their own criteria for when to take a profit or cut a loss.
Ticker AMGN
As you can see in Figures 1 and 2, AMGN triggered an “Alert” on 7/3 and made a new 3-day low on 7/8.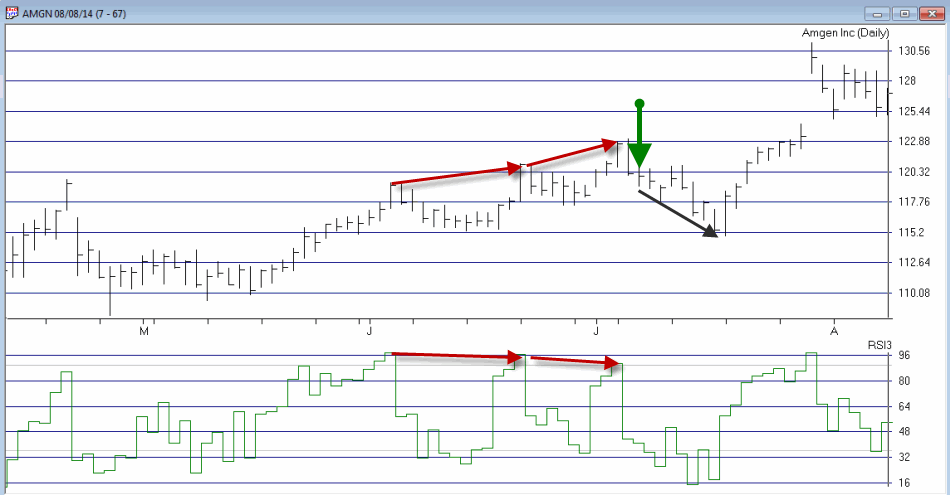 Figure 2 – AMGN (Courtesy: AIQ TradingExpert)
What followed was little more than a modest short-term pullback. Still, as you can see in Figure 3, if a trader bought the October 120 put option on 7/8, by 7/17 he or she would have had an open profit of +40.5%. 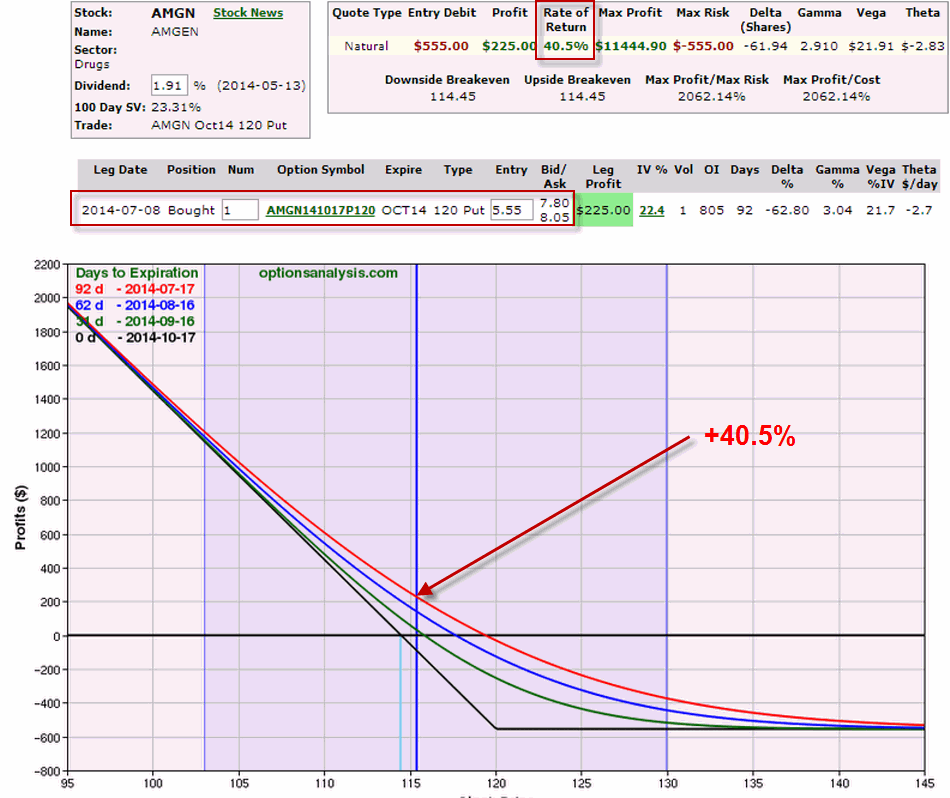
Figure 3 – AMGN Sep Oct 120 put option (Courtesy: www.OptionsAnalysis.com)
Ticker AMZN
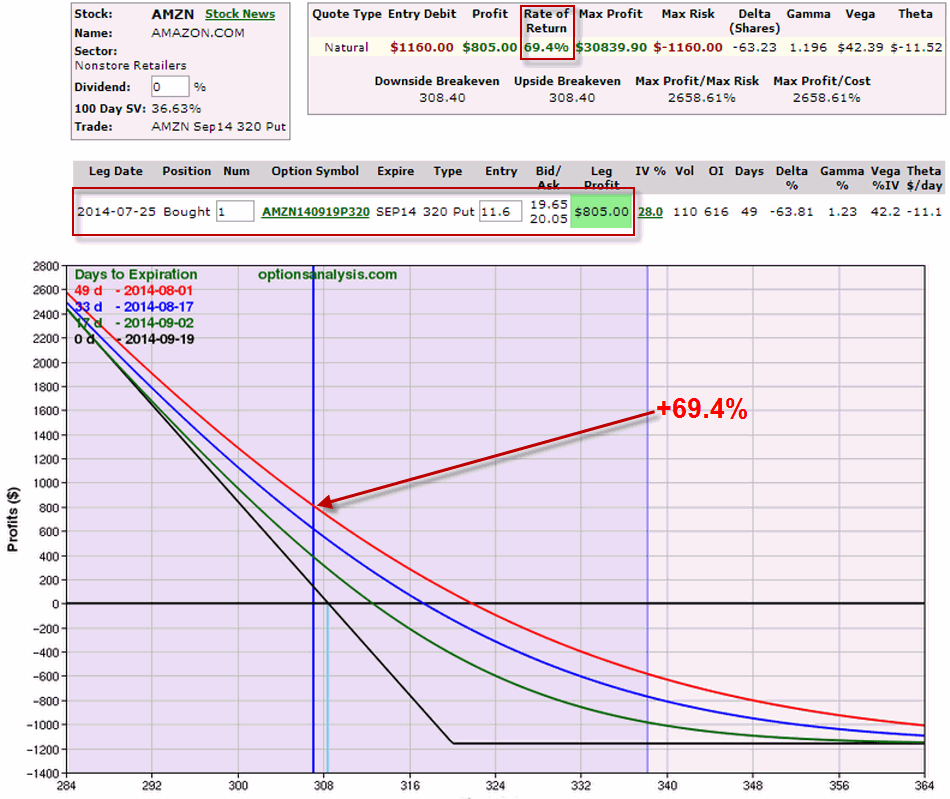
In this example waiting for a 3-day low before entering actually worked against a trader because on 7/25 AMZN gapped significantly lower as you can see in Figure 4.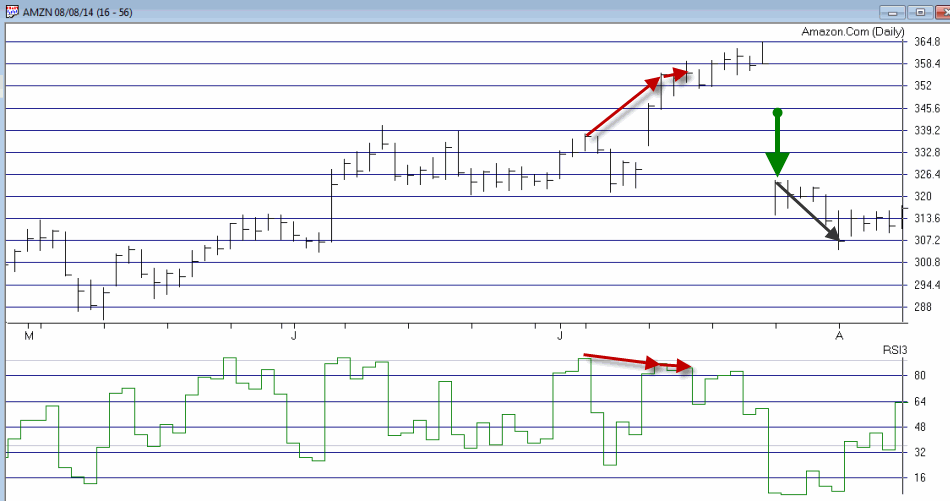 Figure 4 – AMZN (Courtesy: AIQ TradingExpert)
Nevertheless, if a trader had bought the September 320 put option at the close on 7/25, by 8/1 he or she would have had an open profit of +69.4%.
Figure 5 – AMZN September 320 put option (Courtesy: www.OptionsAnalysis.com)
Ticker F
The example that follows for Ford (ticker F) highlights two things:
1. The ability to essentially “bet” on a short-term pullback while risking a relatively small amount of capital
2. The above average profit potential associated with trading options.
Ticker F triggered an “Alert” on 7/24 and made a new 3-day low on 7/25. Figure 6 – F (Courtesy: AIQ TradingExpert)
If a trader had bought the September 17 put option at the close on 7/25, by 8/1 he or she would have had an open profit of +103.6%.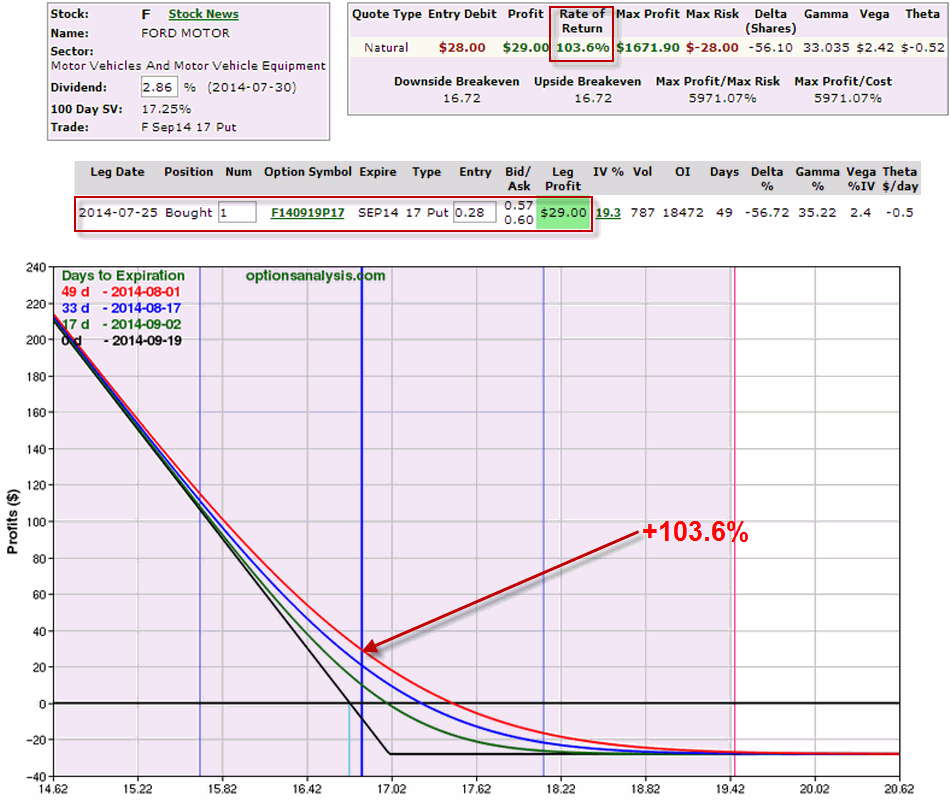 Figure 7 – F September 17 put option (Courtesy: www.OptionsAnalysis.com)
Summary
So once again, the point of all of this is not to attempt to promote the “be all, end all” of trading. Because the TSYO method is most certainly not that. But it can do a pretty decent job of identifying opportunities (especially after the overall market has experienced an extended run up and may be running out of team near term). For traders who are willing to consider alternative (though simple) strategies such as buying put options, a method such as this can offer the potential to make money even as the overall market pulls back.
No one should go out and start making trades using the method I have detailed here without doing some further study/analysis/etc. But the real point of all of this is that it is possible to use relatively simple ideas and relatively little capital to achieve trading success.
Jay Kaeppel


Hi Jay,
I am a faithful follower!
Would you provide the EDS code for RSI 3 Strikes and You’re Out?
Thanks
Jan P.
Jan, sorry..I missed this one. The truth is I don’t have any EDS code for this one. I “eyeball” the charts on a small list of stocks/indexes. Jay
Only one concern: That you would even consider updating the blog while staying in Aruba. Total party foul.
FYI there’s a typo in the URL to options analysis.