With the Fed “pumpin’” and the economy “thumpin’” (as in “thumping along like a flat tire”) it seems unlikely that interest rates would rise. Still, sometimes is makes sense to go against the grain if enough evidence presents itself. So let me show you what I am looking at in the bond market.
EWJ vs. T-Bonds
As I wrote about in a previous article (T-Bonds and Japanese Stocks, Inversely….), for whatever reason, t-bonds have long exhibited a strong inverse correlation to Japanese stocks (no, seriously). In Figure 1 we see EWJ (the ETF that tracks Japanese stocks) with a 5 week and 30 week moving average drawn in the top clip. In the bottom clip we see ticker TLT (the ETF that tracks the 30-year t-bond). You can see that – using highly technical terms that we quantitative analysts types like to use to impress others with how much we know about the markets – when EWJ “zigs”, TLT tends to “zag”, and vice versa.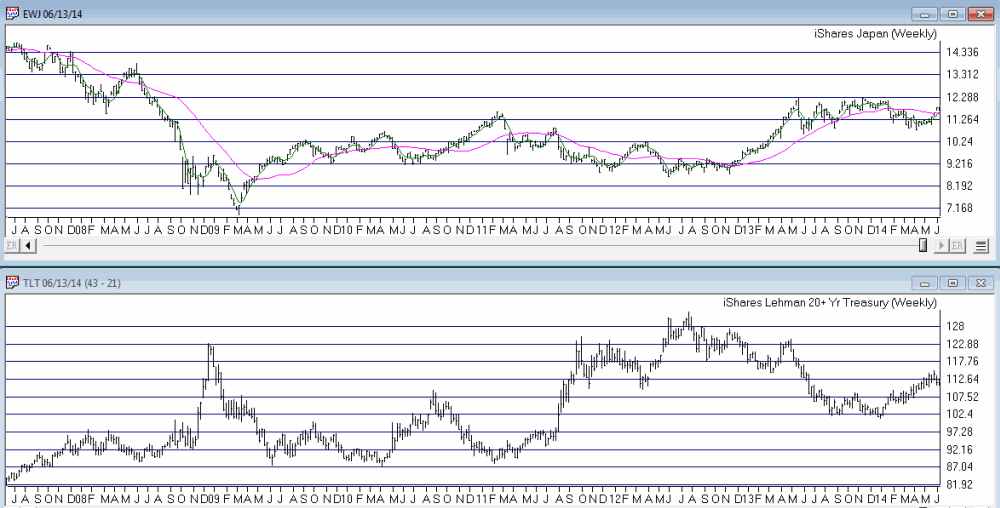 Figure 1 – EWJ with 5-30 week moving averages versus TLT (Courtesy: AIQ TradingExpert)
This past weekend the 5-week moving average for EWJ once again rose back above the 30-week moving average for EWJ. If history is an accurate guide then this may be a negative sign for t-bonds. Although I would be remiss if I did not invoke:
Jay’s Trading Maxim #216: History is not always an accurate guide (but it beats flipping a coin).
Figure 2 displays the raw dollar gain or loss from:
a) Holding a long position in t-bond futures (1 point movement = $1,000) when EWJ 5-week is below EWJ 30-week (red line)
b) Holding a long position in t-bond futures (1 point movement = $1,000) when EWJ 5-week is above EWJ 30-week (blue line)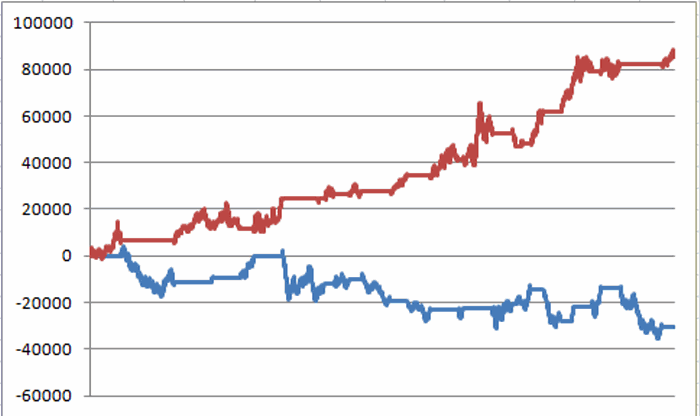 Figure 2 – $(-) from a long position in t-bonds futures when EWJ 5-week MA is BELOW EWJ 30-week MA (red line) and $(-) from a long position in t-bonds futures when EWJ 5-week MA is ABOVE EWJ 30-week MA (blue line) (12/31/1997 to present)
Obviously this indicator is not perfect, but equally obvious is the fact that bonds have typically performed better when the EWJ 5-week MA is below that EWJ 30-week MA. So let’s call this – if nothing else – a potentially negative sign.
TLT vs. Elliott Wave
I am not a true “ElliottHead” but I do tend to pay attention to the Elliott Wave count for a given market when the daily and weekly counts point in the same direction. Figures 3 and 4 present the latest daily and weekly Elliott Wave counts for TLT as figured by ProfitSource by HUBB.
The daily count just completed a bullish Wave 5 (i.e., implying that the latest rally has run its course) and the weekly count is signaling a potentially Bearish Wave 4 sell signal. For the record, I do not believe in the “magic” of Elliott Wave. But I do like when daily and weekly signs for just about any indicator appear to confirm one another.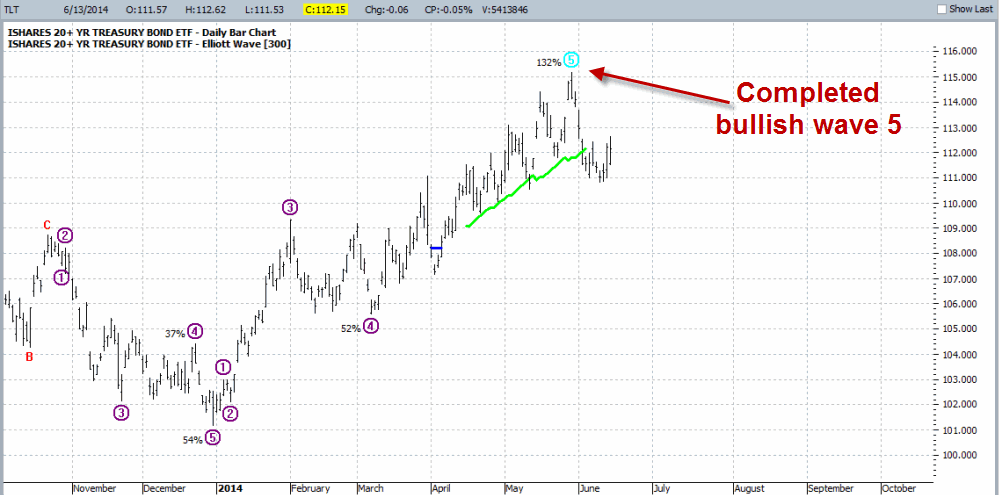 Figure 3 – Daily Elliott Wave Count for TLT; Completed Wave 5 suggests rally is over (Courtesy: ProfitSource by HUBB)
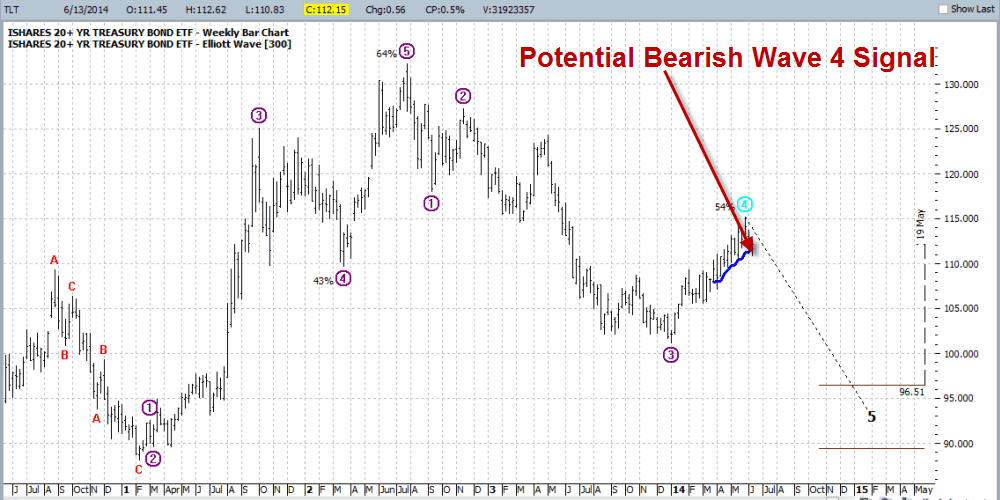 Figure 4 – Weekly Elliott Wave Count for TLT; signaling potentially Bearish Wave 5 signal (Courtesy: ProfitSource by HUBB)
Ways to Play
So if a trader buys the idea that t-bonds will decline in price in the months ahead, there are lots of way to play. A trader could:
*Sell short 100 shares of ticker TLT. This would require roughly $5850 of margin money and would technically entail unlimited risk.
*Trader could buy 100 shares of ticker TBT, an inverse leveraged ETF that is designed to track t-bonds times minus 2 (In other words, if bonds decline -1%, then ticker TBT should rally roughly +2%). This would require roughly $6,200.
*Buy a put option on ticker TLT.
*Buy a call option on ticker TBT.
There are pros and cons to each, but the trade that I want to highlight is buying a call on ticker TBT.
Call on TBT
If t-bonds do decline, then TBT would be expected to advance, hence the reason for considering a call option on TBT. The reason I am looking at this trade is simply because it offers the most “bang for the buck.” Not only are TBT shares leveraged 2 to 1, but by buying a call option we can obtain even more leverage with limited risk. As you can see in Figure 5, TBT has support at roughly $56 and resistance at roughly $80. 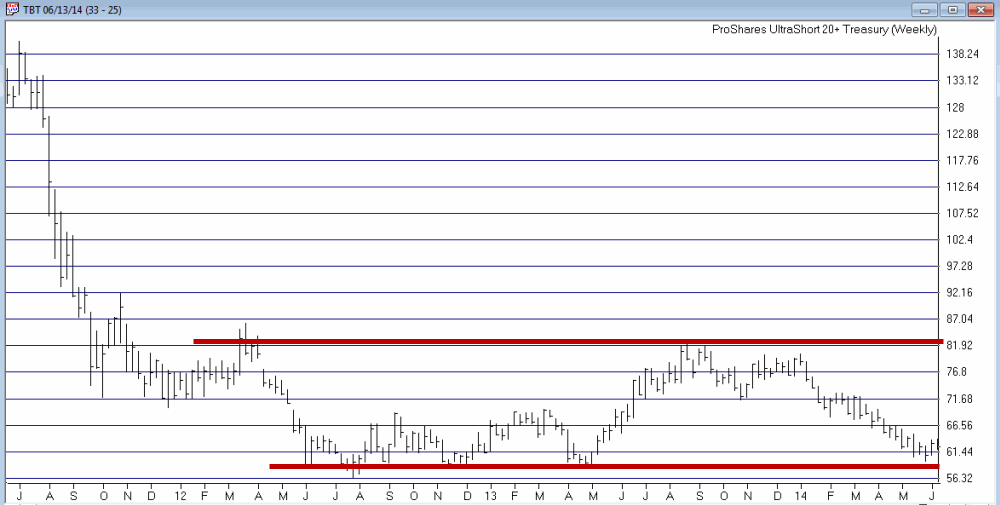 Figure 5 – TBT; support near $56, resistance near $80 (Courtesy: AIQ TradingExpert)
So let’s look at buying the September 62 call for $281 (NOTE: the bid/ask is fairly wide at $2.62/$2.81. For illustrative purpose I am simply assuming a market order and a fill at $2.81. An astute trade might consider a limit order that splits the difference). Figure 6 displays the risk curves for buying the Sep TBT 62 call at $2.81.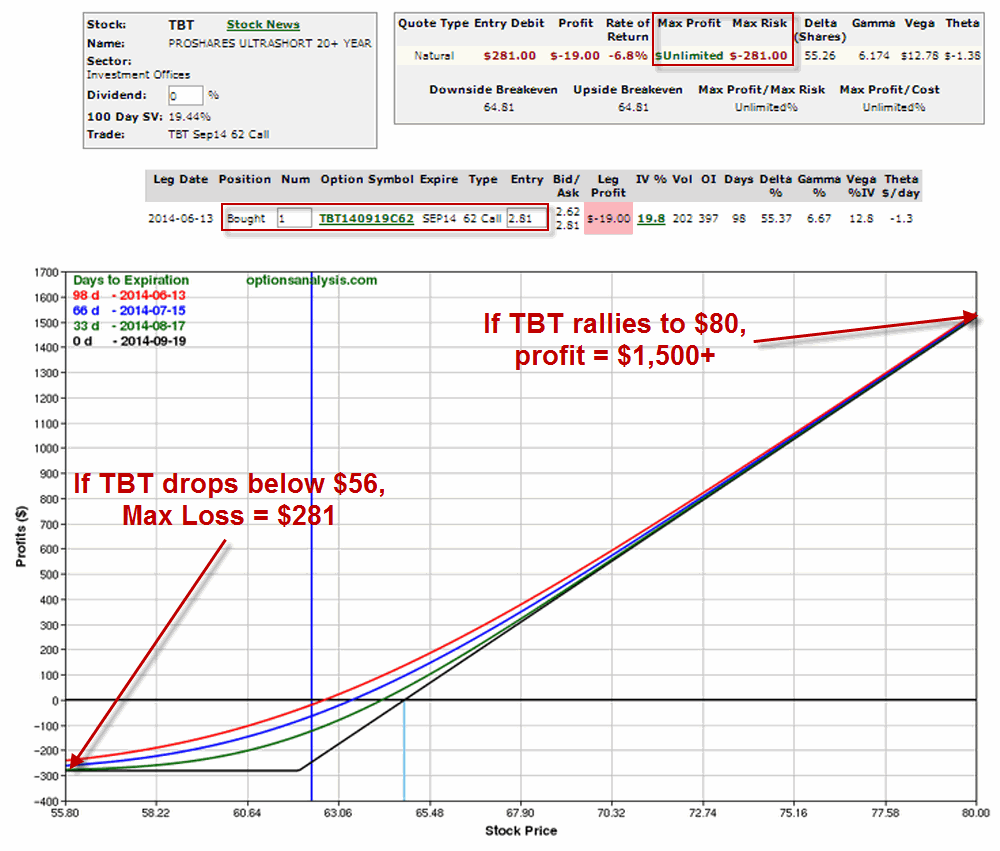 Figure 6 – Risk Curves for TBT Sep 62 call (Courtesy: www.OptionsAnalysis.com)
As you can see, in the worst case the maximum loss is $281. In the best case – i.e., TBT rallies all the way back up to $80, the trade can generate a profit in excess of $1,500. Also there are three months for “something” to happen.
Summary
As always, I am not “recommending” this trade. I am simply pointing out some potentially bearish evidence that I have found in regards to t-bonds and have highlighted “one way” to play such a situation using the limited risk associated with options.
So will t-bonds take a tumble and in turn, will TBT soar, thus generating an excellent rate of return? As always, “It beats the heck out of me.”
But from a trader’s perspective, the real question is, “Am I willing to risk $281 to find out?”
Jay Kaeppel

