OK, I will admit I am acting a bit schizophrenic of late. Yesterday I write an article titled “One Sign That the Bull May Still Have Legs” and today I am writing an article that seemingly suggests that you sell tomorrow. So what gives?
First off a friendly reminder that everything I write on this blog is for “educational purposes only” and I do not make formal “recommendations.” In other words, “I report (whatever I see – or to be technically correct, whatever I think I see), you decide.” (This is slightly but importantly different from most of today’s main stream media whose motto more closely resembles “We decide, then we report.”)
So the Bullish Outside Month I detailed in my last piece remains a bullish factor. But today, let’s look at the other side of the coin by combining two indicators.
The Coppock Guide
Because I am hoping to avoid having too many readers suffer “My God This Sure Seems Complicated – Not to Mention Boring” syndrome, I am going to skip the description of the steps involved in calculating the Coppock Guide (may I suggest Google.com or better yet here). Long story short, the Coppock Guide is a momentum indicator which in this case is updated once a month using the closing price each month for the Dow Jones Industrials Average. Also in this case we are looking at the 2-month rate-of-change in the Coppock Guide Indicator value itself. Interpretation works as follows:
*Current Coppock Guide value > Coppock Guide value two months ago = GOOD
*Current Coppock Guide value < Coppock Guide value two months ago = BAD
For the record, starting in August of 1900 (and assuming no interest while out of the market):
*$1,000 invested in the Dow only when conditions were GOOD is now worth $379,378.
*$1,000 invested in the Dow only when conditions were BAD is now worth $764
That’s +37,838% versus -23.6% (which is what we “quantitative analyst types” refer to as “statistically significant”).
For the record, the Coppock Guide 2-month rate-of-change is now negative, i.e., bearish.
The 40-Week Cycle
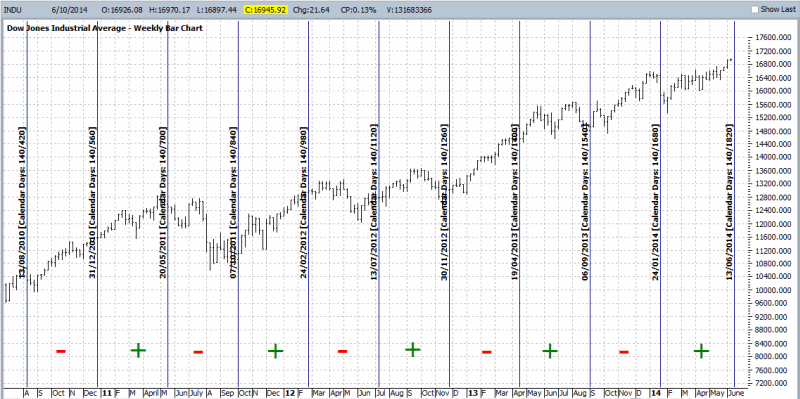
The 40-week cycle can be traced back to April 21, 1967 (no seriously). Since that date, the first 140 calendar day period (20 weeks times 7 days a week) is deemed the “bullish phase” and the next 20 weeks is deemed the “bearish phase.”
One refinement I’ve added is a 12.5% stop-loss. If the Dow drops 12.5% or more on a closing basis from its closing price at the start of a bullish phase, then the cycle is deemed bearish until the end of the current 40-week cycle. Recent cycle phases appear in Figure 1. Figure 1 – The 40-week cycle (20 weeks bullish; 20 weeks bearish) Courtesy: ProfitSource by HUBB
For the record, starting on 4/21/1967 (and assuming no interest earned while out of the market):
*$1,000 invested in the Dow only when 40-week Cycle is bullish is now worth $28,896.
*$1,000 invested in the Dow only when 40-week Cycle is bearish is now worth $664.
That’s +2,790% versus -34% (again, “statistically significant”).
For the record, the 40-Week Cycle reverts to a bearish phase as of the close on 6/13/14.
One thing to note: As you can see in Figure 1 it is not like the Dow necessarily begins to decline the minute a new 40-week bearish phase (marked by “-” signs in Figure 1) begins. So let’s combine the Coppock Guide and the 40-week cycle.
Combining Coppock Guide and 40-Week Cycle
So let’s now take the obvious next step and combine these two indicators. For our purpose, if either indicator is bullish we will call this a “combined bullish phase.” On the other hand of BOTH indicators are bearish – which will be the case starting at the close on 6/13/14 – we will call this a “combined bearish phase.”
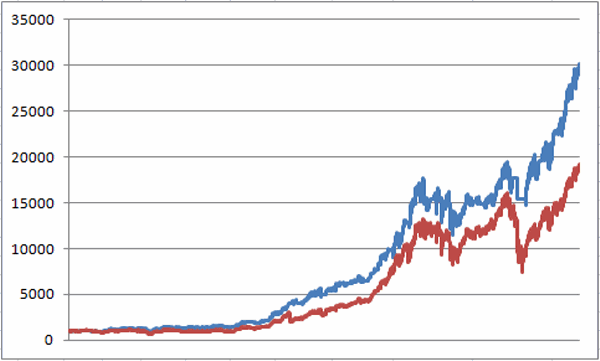
Figure 2 displays the growth of $1,000 invested in the Dow when either or both of the indicators are bullish, i.e., in a “combined bullish phase.” Figure 2 – $1,000 invested only during a “combined bullish phase” (blue line) grew to $30,221 versus $19,187 for buy-and-hold (red line); 1967-present
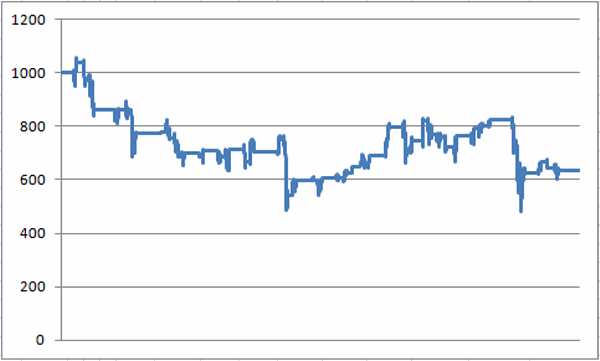
On the flip side, Figure 3 displays the growth of $1,000 invested in the Dow when both indicators are bearish, i.e., in a “combined bearish phase” (again, this will be the case as of the close on 6/13/14). Figure 3 – $1,000 invested only during a “bearish phase is now worth just $635; 1967-present
Summary
So will the Bullish Outside Month propel stock prices higher still? Or does the combined bearish phase for the Coppock Guide and the 40-Week Cycle portend that a market decline is finally in the offing?
As usual I have to go with my stock answer of “It beats me.” But my basic plan remains unchanged. Unless and until the major market averages start to break down I continue to give the bullish case the benefit of the doubt.
After June 13th I will however, be keeping an ever more vigilant “eye on the exits.”
Jay Kaeppel


Thanks for this article. I enjoyed learning about these ideas.
One question,
the stat for Coppock GOOD/BAD conditions starting in August of 1900 is +37,838% versus -23.6%
the stat for 40 week starting in 4/21/1967 i s +2,790% versus -34%
However, the” combined bullish phase” starting in 1967 returned $30,221 versus $19,187 for buy-and-hold (baseline).
I have trouble understanding how such apparent large % improvement relative to +/- of the indicators can only result in a 50% improvement relative to baseline.
Is that because the individual indicator improvements relative to the baseline (of buy-and-hold) are not as large (not presented in your article), or is the performance over time decreasing where Coppock conditions performed much better in the early 20th century, or something else ???
Dave,
Thanks for the question. Not sure about the “why” only the “what”. In other words, the numbers “are what they are.” couple of notes. 1) Yes the Coppock Guide as a standalone indicator did much better in the first half of 1900’s. Part of that is because it can be out of the market for long periods of time. The first half of 1900’s had alot of “long downs”, wheres since 1940’s the stockmarket rises most of the time. 2. The purpose of article is not to tout the two as a “system” per se but merely as a “warning sign.” In a nutshell, historically the market does way better when at least one of these indicators is bullish. After 6/13 that is no longer the case. Hope that helps….Jay