Please see my new article in Technical Analysis of Stocks & Commodities magazine titled “New Tricks With Old Indicators” (http://traders.com/) On Sale Now.
The treasury bond market has showed a strong seasonal tendency to perform poorly during the early part of the year. People often ask me “why” this would be so. In fact I get that question often enough to make me wish I had a good answer. Alas, as a proud graduate of “The School of Whatever Works”, I can only repeat our school motto, which is “Whatever!”
Two Early Year Trends in T-Bonds: Part 1
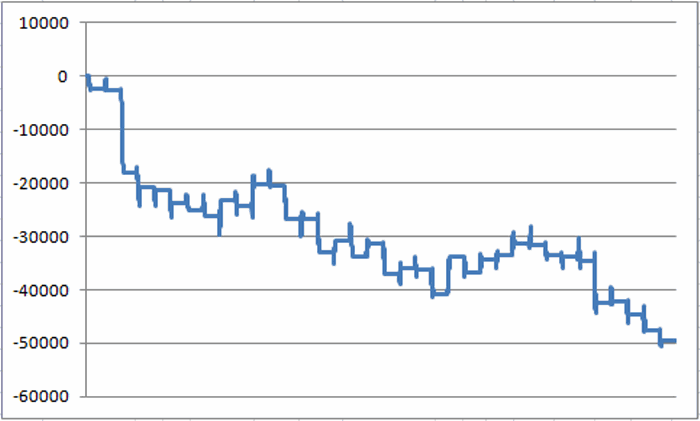
First let’s look at the performance of t-bond futures between the end of the first trading day of the new year and the 14th trading day of February starting in 1978. Figure 1 displays the performance achieved by an (extremely stubborn and not terribly astute) investor who held a long position in t-bond futures during this time period every year.  Figure 1 – Long t-bond futures from on January Trading Day 1 through February Trading Day 14 (1978-present)
All told, the loss came to -$49,511 (excluding any slippage and/or commissions). Of course, like all seasonal trends there is never any guarantee that the trend will hold true the next time around. For the record the Jan TD 1 through Feb TD 14 period saw T-bonds:
-Gain 10 times
– Lose 25 times
-Breakeven 1 time
Each point movement in t-bond futures is worth $1,000
-The median gain during up years was +$2,234
-The median loss during down years was -$2,406
-The largest gain was $6,937 in 2000.
-The largest loss was -$15,281 in 1980.
So basically, t-bonds gained 28% of the time, and lost or broke even 72% of the time, and the median loss was slightly greater than the median gain.
Two Early Year Trend in T-Bonds: Part 2
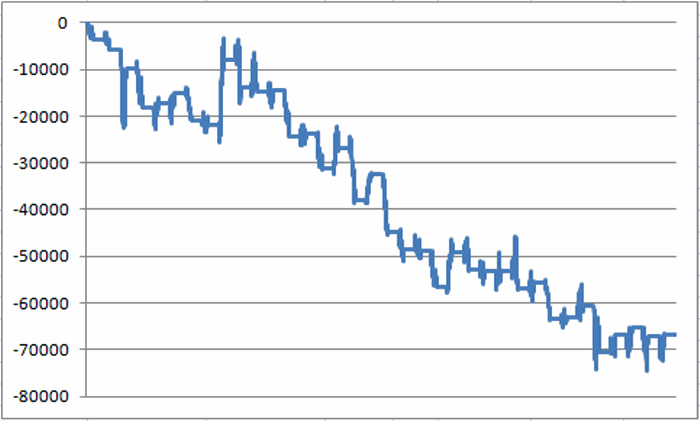
Let’s look next at the net performance for t-bonds during the first four months of the calendar year. Typically, after bonds sink into mid-February there is a bounce in the second half of February. But for our test we will just consider the results achieved by holding a long position in t-bonds from December 31st each year through the end of April. These results appear in Figure 2.  Figure 2 – Long t-bond futures December 31st through April 31st
All told, the loss came to -$66,389 (excluding any slippage and/or commissions). Of course, like all seasonal trends there is never any guarantee that the trend will hold true the next time around. For the record the Dec 31st to Apr 30th period saw T-bonds:
-Gain 16 times
– Lose 20 times
Each point movement in t-bond futures is worth $1,000
-The median gain during up years was +$1,797
-The median loss during down years was -$4,813
-The largest gain was $13,968 in 1986.
-The largest loss was -$11,313 in 1994.
In reality, the January through April time frame has seen t-bonds show a loss only 56% of the time. So this trend is absolutely by no means a sure thing, so the one thing you should absolutely not do is get it in your head that t-bonds are bound to decline between now and the end of April.
The key thing to note regarding this trend is that the median “down” year has witnessed a decline that is 2.7 times larger than the median gain shown during the “up” years. So the key is simply to recognize the potential danger.
Summary
With t-bonds presently quite oversold, it is a little difficult to jump on the bearish bandwagon at the moment (in fact, bonds are rallying nicely as I write here on the first trading day of the year). And as I have tried to make clear, a decline in t-bond prices during either of both of the highlighted periods is by no means a sure thing. Still, this little bit of history suggests that getting wildly bullish on t-bonds may not be the best strategy.
Jay Kaeppel

