This article presents another twist to the one I posted a few days ago titled “A Trader’s Guide to Buying the Dips” (http://jayonthemarkets.com/2013/12/13/a-traders-guide-to-buying-the-dips/). This article presents a variation known as “Jay’s Pullback System”
First let’s look at the building blocks:
A = S&P 500 daily close
B = 10-day simple moving average of S&P 500 daily close
C = (A – B)
Buy Signal = Variable C declines for 3 or more consecutive days
In a nutshell, if the difference between the S&P 500 index (SPX) and its own 10-day moving average declines for 3 straight days we consider this to be a “pullback”, and thus a buying opportunity.
Trading Rules for Basic System:
When Variable C declines for 3 straight days, buy and hold the S&P 500 Index for 5 trading days. If the decline in Variable C extends itself one or more days, then extend the holding period for that many trading days.
So for example, if Variable C declined for 5 straight trading days, one would buy at the close of the third trading day and then hold for seven trading days
Day Variable C Action Position
1 Down
2 Down
3 Down Buy at close (hold for 5 days)
4 Down Hold (Var. C down again; hold for 5 days) Long
5 Down Hold (Var. C down again; hold for 5 days) Long
6 Up Hold (for 4 days) Long
7 Down Hold (for 3 days) Long
8 Up Hold (for 2 days) Long
9 Down Hold (for 1 day) Long
10 Up Sell at close Long; Flat at close
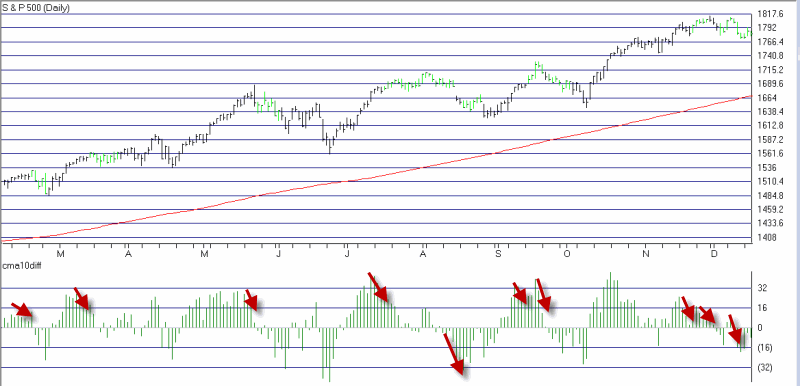
Figure 1 displays “bullish days for SPX in green. In the lower clip we see the difference between the close and the 10-day moving average (i.e., Variable C). A “bullish” period is signaled when that value declines for 3 straight days Figure 1 – Basic System bullish days for SPX (Courtesy AIQ TradingExpert)
Results:
This is a very rudimentary “system” and not suitable for many traders (note this raw system includes no stop-loss provision and does not attempt to filter for and trade with the major trend).
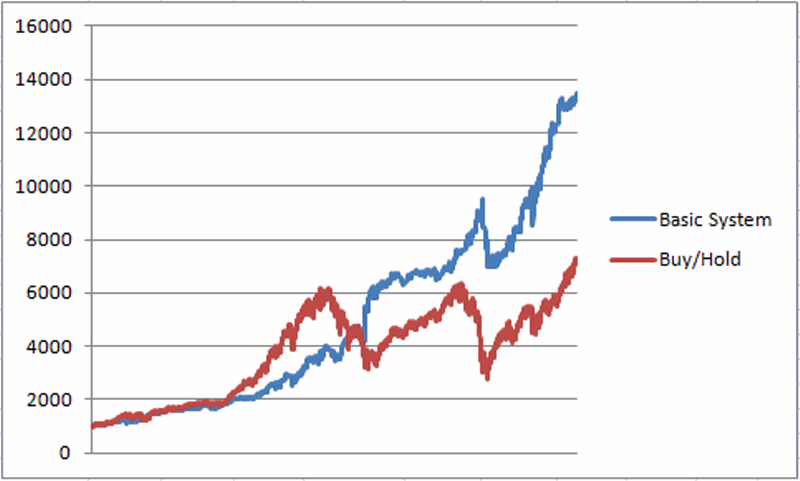
In any event, let’s look at what would have happened if one had followed the rules and held the S&P 500 for 5 trading days following every decline in Variable C of 3 days or more, and earned 1% of annual interest while out of the market. Those results are displayed (along with the growth of $1,000 achieved by buying and holding the S&P 500 Index) in Figure 2. Figure 2 – Simple Pullback Systems (blue line) versus Buy and Hold (red line) Dec 1987 to present
Results:
-$1,000 invested using this system grew to $13,249 (+1,225%)
-$1,000 invested using buy-and-hold grew to $7,208 (+621%)
So we can reasonably state that these results are pretty good. Can they be improved? Let’s see.
Jay’s Pullback System
With this system we will filter for the trend and at times use leverage.
First we will note if the daily close for the S&P 500 Index is above or below its own 250-day moving average.
If Variable C above declines in value 3 straight days:
-If SPX > 250-day moving average we will buy using leverage of 2-to-1
-If SPX < 250-day moving average we will buy using no leverage
-Interest of 1% per year will be assumed when out of the market.
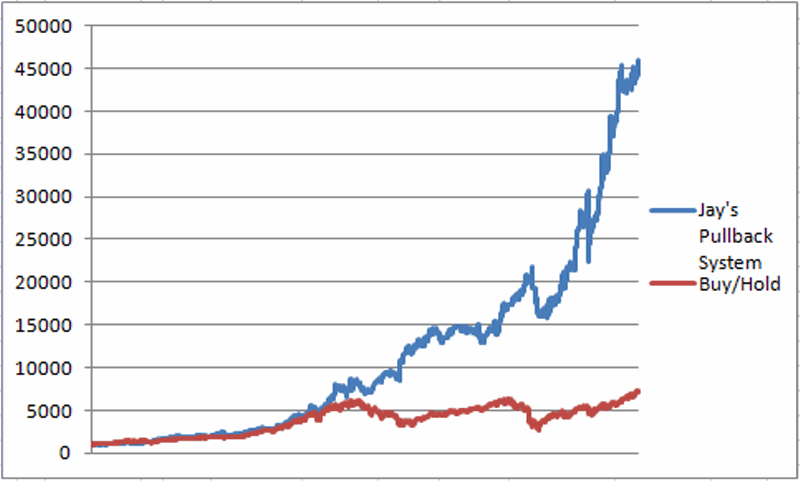
The results of this test appear in Figure 3. Figure 3 – Jay’s Pullback System: Growth of $1,000 (blue line) versus buy and hold (red line; Dec 1987-present
Results:
-$1,000 invested using Jay’s Pullback System grew to $44,541 (+4.354%)
-$1,000 invested using buy-and-hold grew to $7,208 (+621%)
Funds to Use
Mutual Fund: Profunds ticker BLPIX (S&P x 1)
Mutual Fund: Profunds ticker ULPIX (S&P x 2)
ETF: Ticker SPY (S&P 500 x 1)
ETF: Ticker SSO (S&P 500 x 2)
Summary
While the numbers for the leveraged system look pretty good, it should be noted that there are no stop-loss provisions incorporated. Before you decide to run off and trade any system – particularly one that may use leveraged funds or ETFs, you ought to do some homework and make sure you fully understand and can tolerate the risks involved.
Still, the real point of all of this is simply to note that buying on dips is a valid approach to trade the stocks markets.
Jay Kaeppel


One practical concern with this system is that it requires you to determine the 10-day MA – based on the Close, no less – before you’ve actually gotten to the Close of that day. Reading the future, in other words.
What do you think about instead waiting for the close of that third day to determine if variable C has declined 3 times in a row, and then setting a limit order the next day for Close of the previous day. This would miss some trades, but it would also err on the side of buying at or below the original system’s price. Then hold for four days (plus any additional days added because of continuing declines), exiting at close of the day as usual.
When you say five days, you’re counting the entry at close as the first day, and the exit at close as day 5 right?
Also, while you say there are no stops involved, any system that has a time limit is in effect a stop loss. Especially a system like this that has a very small length of time for each position. Perhaps a maximum length to hold would help for those truly disastrous transitions to bear markets.