In my recent MTA webinar (http://go.mta.org/watch112013), I emphasized the point that there has never been a better time to be a trader. The number and variety of opportunities available is fairly amazing. So let’s take a look at another trading opportunity that was not available at all not that long ago.
Here are the Trigger rules:
-VIX Index <=20
-(VIX Index close – VIX Index 10-day moving average) is greater than or equal to 3.00 points
-(VIX Index close – VIX Index 10-day moving average) then declines for one day (i.e., the gap is less than the value yesterday and yesterday’s value was +3.00 points or more).
When this happens:
– Buy a put option on ticker VXX using the following guidelines:
-At least 40 days left until expiration
-The highest Gamma among near-the-money puts
Hold until:
The 4-day RSI for the VIX Index itself drops to 30 or below.
For the record, this strategy has an extremely limited track record, so I would not be too quick to jump on board. Still the results are promising.
Figure 1 displays ticker VIX with some signal dates noted.  Figure 1 – VIX Index (Courtesy: AIQ TradingExpert)
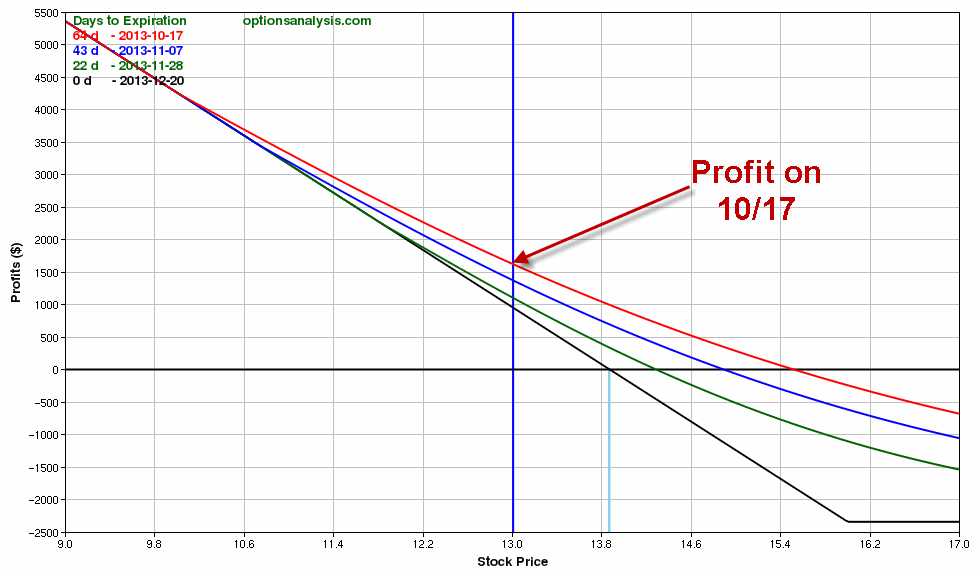
Figures 2, 3 and 4 display the most recent VXX trade signaled Figure 2 – VXX high Gamma puts (Courtesy: www.OptionsAnalysis.com)
 Figure 3 – VXX Put trade (Courtesy: www.OptionsAnalysis.com)
  Figure 4 – VXX Put trade (Courtesy: www.OptionsAnalysis.com)
Results
Figure 5 displays the hypothetical results (note no deductions for slippage and commissions) assuming that $2,500 was committed to each trade. Also note that it is possible to have more than one trade on at a time.  Figure 5 – Hypothetical Results 2012-2013
Summary
Again, this is a very limited track record. Also, because this method looks at the raw number of points between the VIX close and it’s 10-day moving average (rather than a percentage difference) it is probably only useful when the VIX is at a relatively low level (i.e., below 20).
But it does provide one more potentially useful arrow in the quiver for an alert trader.
Jay Kaeppel


In the results, what is the second column labeled Price? It doesn’t correspond to the VIX on those dates (at least from the Yahoo Finance ^VIX chart).
Kevin H
Excellent question! That “Price” is the price of ticker VXX and NOT VIX as of that date. Also confusing things a bit is the fact that VXX experienced a 1-to-4 split recently. So for example, as of 10/9/13 the price of ticker VXX was 16.37. However, if you look it up now it will show the split adjusted price of 65.48. Hope that clears it up.
Jay